%20(1).png?width=2500&height=1667&name=Portal%20Drop%20Down%20(1)%20(1).png "Take a Tour of Adswerve Connect")
Share


Intro
Google App Scripts is a great tool which is often overlooked or, at least, is not as known as other Google services. However, most of the time it gets the job done very smoothly! It has many of Google’s most used APIs built in making it very useful and easy for all sorts of different integrations and use cases. But you're not limited to just Google’s ecosystem…you can easily connect to other APIs that might be useful to you. This blog post is geared toward people who've previously interacted with App Scripts and/or know a little bit of javascript. If you're a total beginner, no worries. For how to get started with App Scripts and to find another great use case for it, you can read one of our previous blog posts .Use Case
You're running your company’s analytics team and you were asked to provide daily email reports with various metrics from Google Analytics that stakeholders need to look at every morning. You could ask your capable but small-and-always-busy IT team for help. They may respond by saying it's certainly possible but they're busy, this would not be the priority, and something about servers and cron jobs… You understand what they're saying but you just can’t afford to start rolling it out 2 months from now. Then you find a blog post and you're fairly familiar with javascript…The Goal
We want to send a PDF report attached to an email every day. We want to make it somewhat presentable and throw in a chart or two. PDFs are nice because most email clients allow you to preview it very quickly. To make this work we’ll need to connect to a few different APIs and internal App Scripts services. We’ll use Google Analytics Reporting API, Google Sheet API, Google Drive API, App Scripts’ email service and App Scripts’ templating service. For all TL;DR types here is the complete code which is explained below.Step 1: Get the Data
Both versions (v3 and v4) of GA reporting API are build into App Scripts. In this case we're going to use v3 which might be better known and slightly easier to configure. All code that deals with data pulling is located in DataSource.gs file.getData: function(params) { // the only dimension we want is date, // also sort by descending date var options = { 'dimensions': 'ga:date', 'sort': '-ga:date' }; // use params to get viewId, // set date range for the last 30 days, // specify requested metrics var report = Analytics.Data.Ga.get("ga:" + params["viewId"], "31daysAgo", "yesterday", "ga:users,ga:sessions,ga:bounceRate", options); var data = [ // this will act as a header [ "Date", "Users", "Sessions", "Bounce Rate %" ] ]; for (var i = 0; i < report.rows.length; i++) { // format date column so Google Sheets is able to recognize it as a date report.rows[i][0] = CommonUtils.formatDate(CommonUtils.parseYYYYMMDDDate(report.rows[i][0]), 'yyyy-MM-dd' ); data.push(report.rows[i]) } return data; }This code pulls GA metrics user, sessions and bounce rate broken down by date for the last 30 days. The GA Reporting API returns date in the ‘yyyyMMdd’ format. To make it more readable, and for Google Sheets to recognize it as a date, we need to convert it into ‘yyyy-MM-dd’ format. To do that, we first need to parse it to a javascript Date object, which is done by the CommonUtils.parseYYYYMMDDDate function, then format it with CommonUtils.formatDate. The function returns array of arrays, where every array represents a row of data.
Step 2: Create a Google Sheet and write data to it
We have pulled our data in step 1, now we need to write it somewhere. Because we want to stylize it later our best bet is to use Sheets API, which is again built into App Scripts. We've prepared our data in such a way that it’ll be very easy to write into the newly created sheet. All code that deals with Google Sheets is in the SheetUtils.gs file./* * createSheet: creates a new Google Sheet, writes and stylizes data * name: name of the Google Sheet document * data: array of arrays representing table data format */ createSheet: function(name, data) { // create Google Sheet file var ss = SpreadsheetApp.create(name); // grab the first sheet of the document var sheet = ss.getSheets()[0]; // write data to the sheet for (var i = 0; i < data.length; i++){ sheet.appendRow(data[i]); } // make sure everything has been applied before continuing SpreadsheetApp.flush(); // return the id of the create Google Sheet return ss.getId(); }The code is pretty simple, we create a new spreadsheet with some predefined name and obtain the first sheet (usually there are 3 by default). Then we loop through our data and use appendRow to write data to the sheet. Last step is to flush everything we’ve done, so we can be sure everything got updated and return spreadsheet id for future reference.
Step 3: Make It Pretty
We have data in our spreadsheet now, which is exactly where we want it to be. Built in spreadsheet services allow you to stylize and format your sheet as if you were doing it through the UI in Google Sheets. We have prepared a sample stylizing function (but much more is possible if you get into the details of the service). More can be found here .stylize: function(ssId) { // load spreadsheet var ss = SpreadsheetApp.openById(ssId); // grab the first sheet of the document var sheet = ss.getSheets()[0]; // make header bold and create border at the bottom sheet.getRange("A1:D1") .setFontWeight("bold") .setBorder(false, false, true, false, false, true, "black", SpreadsheetApp.BorderStyle.SOLID); // make column A formatted as date sheet.getRange("A2:A") .setNumberFormat('yyyy MMM dd'); // make column D's number formats unified sheet.getRange("D2:D") .setNumberFormat('#.0'); // create a line chart with users and sessions var chartBuilder = sheet.newChart(); chartBuilder.addRange(sheet.getRange("A1:C")) .setChartType(Charts.ChartType.LINE) .setPosition(1, 6, 0, 0) .setOption('title', 'Users and sessions'); sheet.insertChart(chartBuilder.build()); // auto-resize each column, columns start with 1 for (var i = 0; i < 4; i++){ sheet.autoResizeColumn(i+1); } // make sure everything has been applied before continuing SpreadsheetApp.flush(); }First, we make the header bold and set a border at the bottom of the first 4 cells. Next, we can format out date column in a format we want and/or prefer. Our last column is bounce rate which is a decimal point number, to make the whole column more readable, we can set a unified number format with 1 decimal point. With just a few lines we can throw in a little chart showing users and sessions with date as an x-axis. Lastly, resize all columns to make sure they're wide enough to fit all the text.
Step 4: PDF
We know you can export Google Sheet documents to PDF if you're in the UI. Turns out you can do exactly the same through Drive API. Once we've finished styling our sheet we just need to download it as a PDF. The actual exporting from Drive is not built in as part of a Drive service in App Scripts, but because App Scripts allows us to craft our own HTTP requests, we can create one that does this functionality for us. All code that deals with Drive API is in DriveUtils.gs file./* * downloadXLSX function accepts fileId parameter and downloads a file * with that fileId * fileId: id of a Google Sheet file */ downloadAsPdf: function(fileId) { // get file in Drive by file id var file = Drive.Files.get(fileId); // set export type to PDF var url = file.exportLinks[MimeType.PDF]; // set http headers and options var options = { headers: { Authorization:"Bearer "+ ScriptApp.getOAuthToken() }, muteHttpExceptions : true // Get failure results } // call the API to get the exported file var response = UrlFetchApp.fetch(url, options); var status = response.getResponseCode(); var result = response.getContentText(); // check if request succeeded if (status != 200) { // get additional error message info, depending on format if (result.toUpperCase().indexOf("<HTML") !== -1) { var message = result; } else if (result.indexOf('errors') != -1) { message = JSON.parse(result).error.message; } throw new Error('Error (' + status + ") " + message ); } // get bytes/file from the response var doc = response.getBlob(); return doc; }
Step 5: Putting it all together
All we need to do now is to send the report via email and we're done.Email Templating
To easily craft a beautifully styled email we used HTML service, which is App Scripts very useful templating engine. Here is our very simple template:<p>Hello, <b><?= data["name"] ?></b>,</p> <p>your report from <?= data["date"] ?> is ready!</p><?= > denotes a parameter to be inserted in place of the tags. If we use the following object {“name”: Anže, “date”: “2017-01-16”} as template data then the rendered template will look like this:
 More on advanced features of templating engine like loops can be found
here
.
The code that does this is also pretty simple (
EmailTemplateUtils.gs
):
More on advanced features of templating engine like loops can be found
here
.
The code that does this is also pretty simple (
EmailTemplateUtils.gs
):
var EmailTemplateUtils = {

  /*
  * evaluate: evaluates a template against data and returns rendered html
  * templateName: name of the template without the .html extension
  * data: js object with parameters to be binded to the html template
  */
  evaluate: function(templateName, data) {
    var t = HtmlService.createTemplateFromFile(templateName);
    t.data = data;
    var c = t.evaluate();
    var html = c.getContent();
    return html;
  }

}
Sending the Email
This part is extremely easy. App Scripts does everything for us in one line of code:MailApp.sendEmail({ to: '<comma separated emails>', subject: "<subject>", attachments: [ ], htmlBody: template });
Code.gs
In Code.gs there is a single function called main which puts all of the steps together:function main() { var yesterday = CommonUtils.getDate(1); var reportName = "my_report_" + CommonUtils.formatDate(yesterday, "yyyyMMdd"); // STEP 1 // set up from what view you want the data to be pulled var dataParams = { "viewId": "<viewId>" } var data = DataSource.getData(dataParams); // STEP 2 var ssId = SheetUtils.createSheet(reportName, data); // STEP 3 SheetUtils.stylize(ssId); // STEP 4 var fileBlob = DriveUtils.downloadAsPdf(ssId); fileBlob.setName(reportName + '.pdf'); // either delete created sheet or move it to trash //DriveUtils.moveToTrash(ssId); DriveUtils.deleteForever(ssId); // STEP 5 var emailParams = { name: "Anže", date: CommonUtils.formatDate(yesterday, "yyyy-MM-dd") } MailApp.sendEmail({ to: 'anze@analyticspros.com', subject: "My Report (" + CommonUtils.formatDate(yesterday, "yyyy-MM-dd") + ")", attachments: [ fileBlob ], htmlBody: EmailTemplateUtils.evaluate("emailTemplate", emailParams) }); }What we see is just a sequence of all the steps described above up to the point when we send the email.
Setting the trigger
Almost done! A great thing about App Scripts is it also allows you to set a trigger for a specific function. We'll use a time based trigger so our main function in Code.gs runs every day at 9 AM.- Click on the time icon in the toolbar
- Click on the “Click here to add one now.”
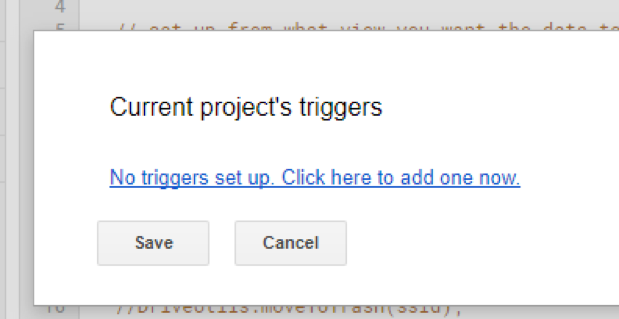
- Set up the trigger like it’s shown in the screenshot:
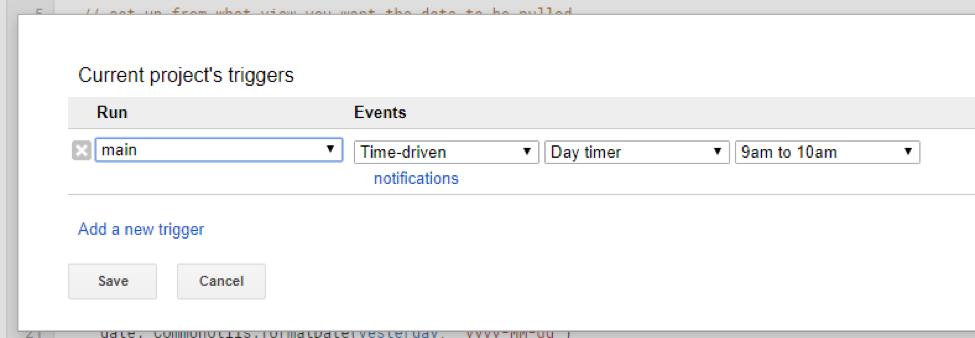
- Click save
The Report
You don’t need to wait until the next day to get the report, in the toolbar you can select main function and press the play button. You should get the report sent over to your email in a few seconds. It should look something like this: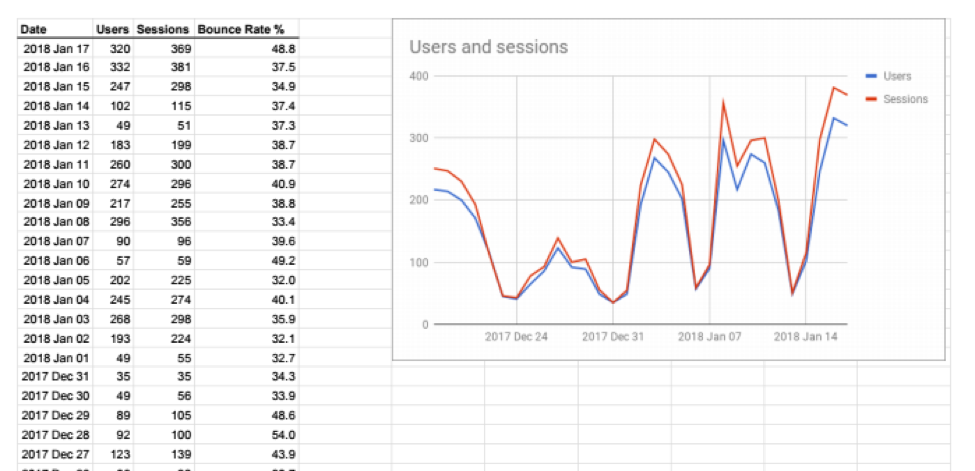
Final Thoughts
For this example we chose Google Analytics as our data source, but as you have seen it’s fairly easy to switch to any other API either already built in or some that are publicly available. For some inspiration, a popular choice would be to use BigQuery as a data source and report on various types of data you might have stored there. Is a BigQuery API built into App Scripts? Yes it is! Whichever Google’s APIs you end up using, don’t forget to enable them first in App Scripts and second in the GCP project associated with your script.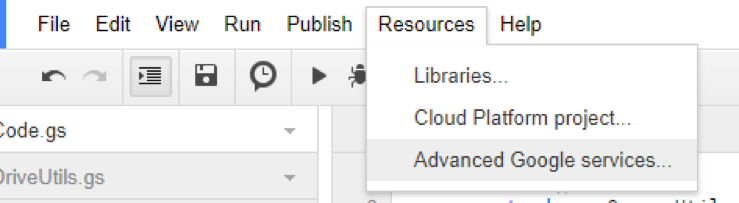
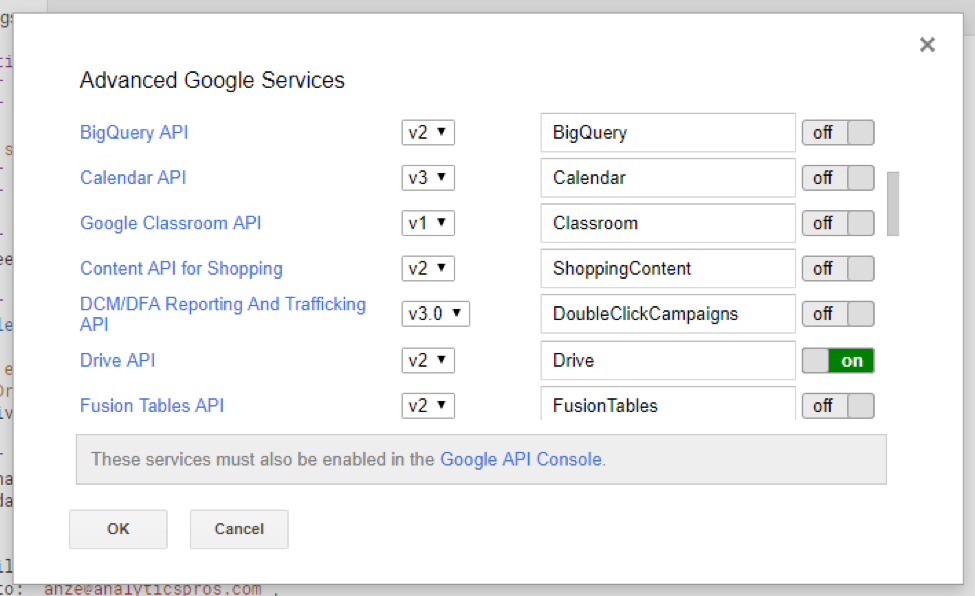 In this example we had to enable Google Analytics API (v3) and, as shown in the screenshot, Drive API. After you enable it in App Scripts make sure to click on “Google API Console” to also enable the same APIs globally for the GCP project. Let us know if you wish to see more App Scripts blog posts or have specific questions regarding this one.