%20(1).png?width=2500&height=1667&name=Portal%20Drop%20Down%20(1)%20(1).png "Take a Tour of Adswerve Connect")
Share


You’ve done it again, Google Analytics! You have provided a feature that made me feel like a true data magician.
Yesterday I received a reporting request from a client that seemed impossible. When I pitched the idea to my coworker he said, “They’re used to using Adobe Analytics, so if it’s not doable in Google Analytics you can just tell them that.” This struck me on a couple of different levels—I am wildly stubborn and my heart beats solely for Google Analytics.
The request centered around this client’s need to see their data broken down by geographical distinctions that are unique to their business model. Their designations are similar to most, in that they were interested in seeing how their EMEA region is performing versus others like APAC and LATAM. They needed this report to have a fairly tight turnaround and didn’t have the time to wait for the data from a custom dimension to start rolling in.
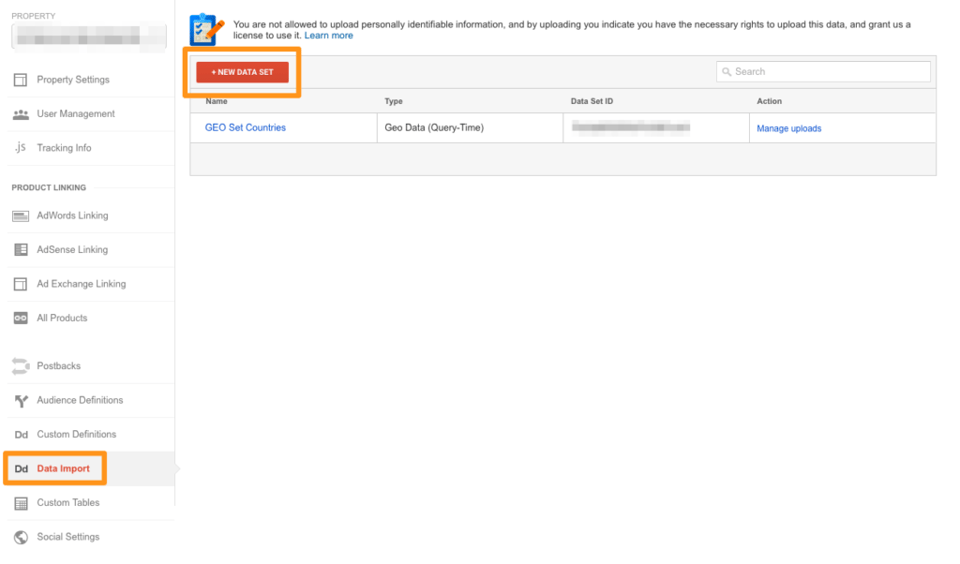 Begin by navigating to the Data Import section of the Property settings in your Google Analytics Premium account.[/caption] [caption id="attachment_31846" align="alignleft" width="1023"]
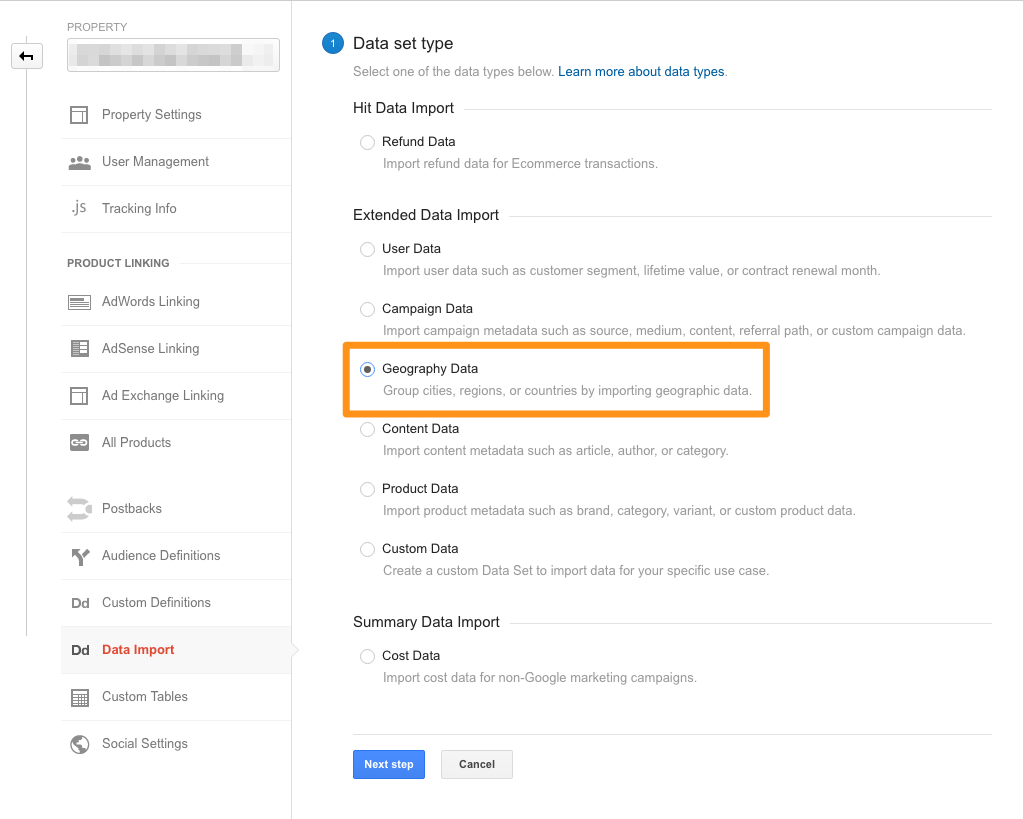 Once you've created your new data set, select which type of data you would like to join.[/caption] [caption id="attachment_31845" align="alignleft" width="796"]
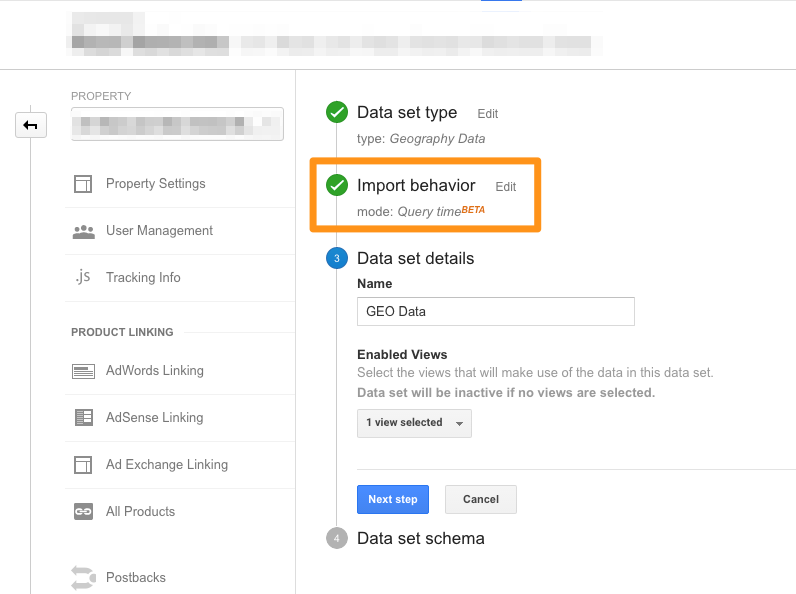 Make sure you have selected Import Behavior --> Query Time(Beta).[/caption] The clincher on QT import is that it’s actually retroactive, and can be joined to data that has already been processed. What’s more, it is reversible – meaning that if you need to change your schema, or delete your upload in the future, all of your unaltered data will still be there, unscathed. These two things are what distinguish this new feature from its older cousin, the processing time import. [caption id="attachment_31844" align="alignleft" width="692"]
 Your new data must have a key to join to. This is where you'll make sure you've selected your new custom dimension.[/caption] [caption id="attachment_31843" align="alignleft" width="712"]
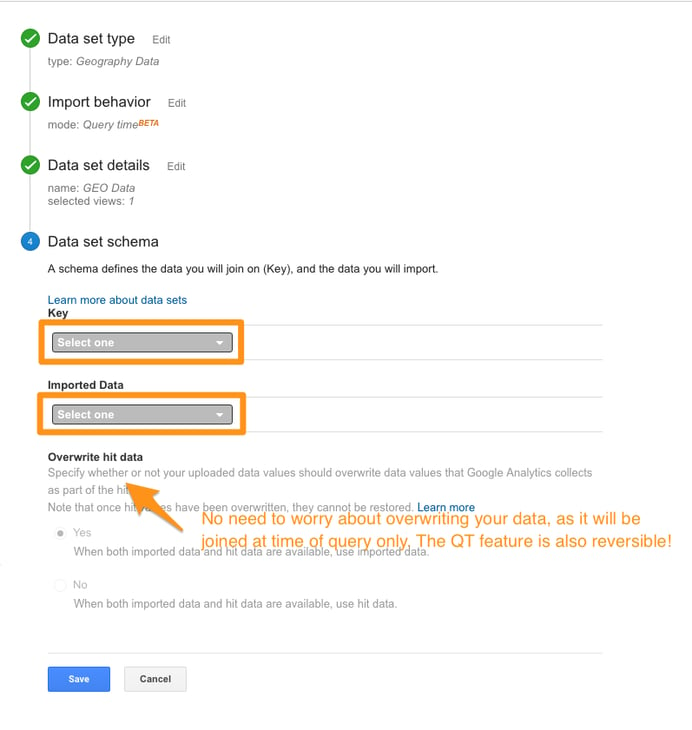
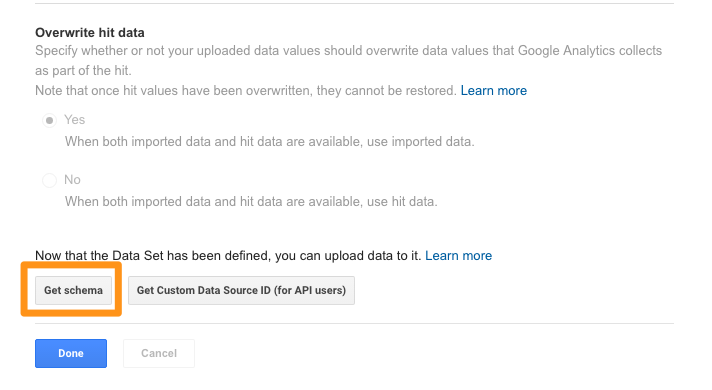 No need to overwrite data! QT works seamlessly without overriding data at time of processing.[/caption] [caption id="attachment_31842" align="alignleft" width="797"]
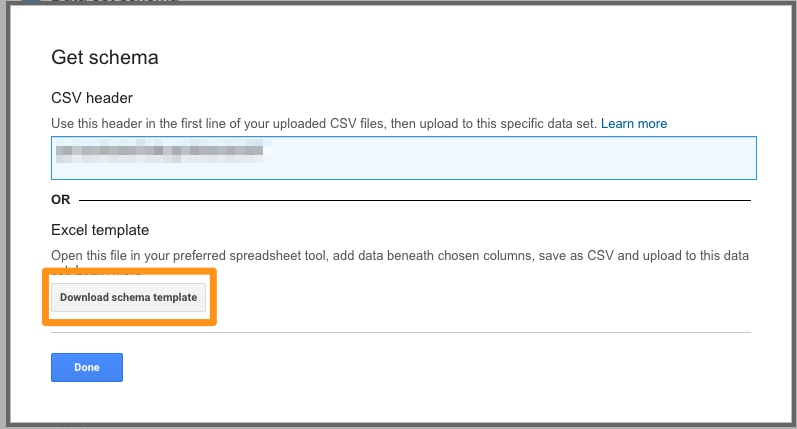 Downloading your schema template is easy. It'll populate in CSV format, making it easy for you to fill in the columns required.[/caption]
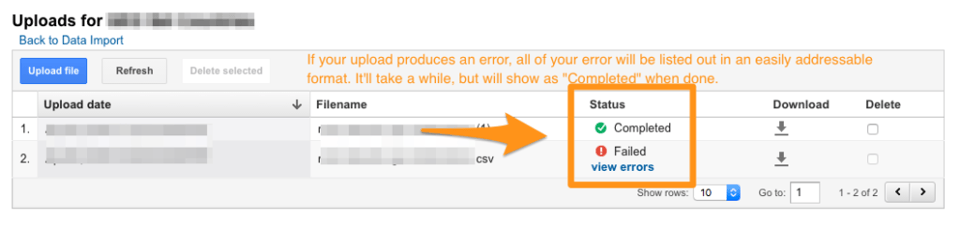 Look out for your file to completely upload. There will likely be errors, so refer to the list that is provided to you, and update your CSV accordingly.[/caption] [caption id="attachment_31849" align="alignleft" width="854"]
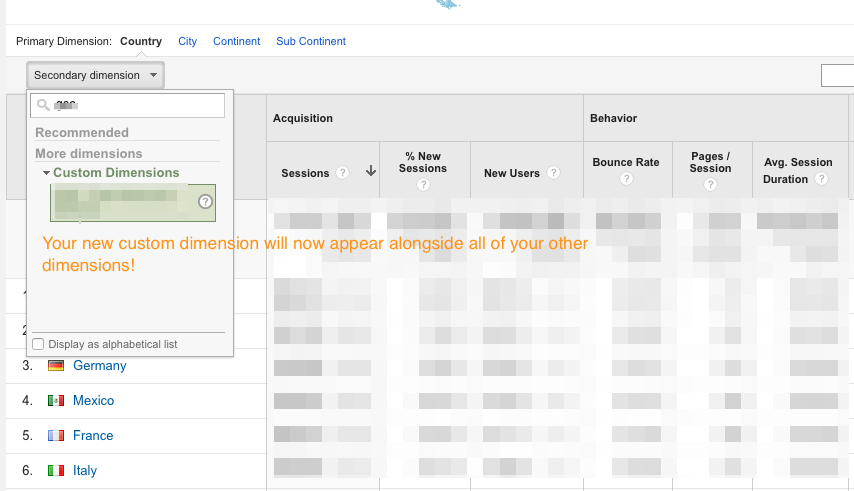 Pivot your reports with your brand new Custom Dimension. This is where the magic happens.[/caption] There are several different pieces of documentation that Google provides to help with the process of setting this up, and I spent a fair amount of time toggling back and forth between all of them. (You can those guides
here,
here,
here, and
here.)
If you’re interested in dimension widening and you’d like help getting it set up correctly, email our team at
gethelp@analyticspros.com
. If you’re already utilizing this feature, I’d like to hear how it’s helping you further your analytical efforts!
Pivot your reports with your brand new Custom Dimension. This is where the magic happens.[/caption] There are several different pieces of documentation that Google provides to help with the process of setting this up, and I spent a fair amount of time toggling back and forth between all of them. (You can those guides
here,
here,
here, and
here.)
If you’re interested in dimension widening and you’d like help getting it set up correctly, email our team at
gethelp@analyticspros.com
. If you’re already utilizing this feature, I’d like to hear how it’s helping you further your analytical efforts!
Meet Query-Time Processing
As of today, Google Analytics does not offer any features as a part of their Geographical Targeting that would allow a user to utilize those marketing distinctions out of the box and apply them retroactively in their reports. What they do offer is something called Query-Time Processing data import, which is a brand new Beta feature for Premium/360 clients only. Looking back on several situations in the past couple of months, I realize how much I could’ve been utilizing this functionality to make my job as an analyst significantly simpler. Query Time import is contained in the Data Import section of your Google Analytics Property settings. It functions very much like other data import features that have been available for some time now, but has a built in upgrade. [caption id="attachment_31847" align="alignleft" width="960"] Begin by navigating to the Data Import section of the Property settings in your Google Analytics Premium account.[/caption] [caption id="attachment_31846" align="alignleft" width="1023"]
Once you've created your new data set, select which type of data you would like to join.[/caption] [caption id="attachment_31845" align="alignleft" width="796"]
Make sure you have selected Import Behavior --> Query Time(Beta).[/caption] The clincher on QT import is that it’s actually retroactive, and can be joined to data that has already been processed. What’s more, it is reversible – meaning that if you need to change your schema, or delete your upload in the future, all of your unaltered data will still be there, unscathed. These two things are what distinguish this new feature from its older cousin, the processing time import. [caption id="attachment_31844" align="alignleft" width="692"]
Your new data must have a key to join to. This is where you'll make sure you've selected your new custom dimension.[/caption] [caption id="attachment_31843" align="alignleft" width="712"]
No need to overwrite data! QT works seamlessly without overriding data at time of processing.[/caption] [caption id="attachment_31842" align="alignleft" width="797"]
Downloading your schema template is easy. It'll populate in CSV format, making it easy for you to fill in the columns required.[/caption]
Potential use cases for Query Time import
- Segmenting your subscribers around the month their contract began
- Uploading descriptive colors to a designated set of product IDs
- Using specialized neighborhood distinctions to determine where to run group-specific content
Look out for your file to completely upload. There will likely be errors, so refer to the list that is provided to you, and update your CSV accordingly.[/caption] [caption id="attachment_31849" align="alignleft" width="854"]
Pivot your reports with your brand new Custom Dimension. This is where the magic happens.[/caption] There are several different pieces of documentation that Google provides to help with the process of setting this up, and I spent a fair amount of time toggling back and forth between all of them. (You can those guides
here,
here,
here, and
here.)
If you’re interested in dimension widening and you’d like help getting it set up correctly, email our team at
gethelp@analyticspros.com
. If you’re already utilizing this feature, I’d like to hear how it’s helping you further your analytical efforts!