%20(1).png?width=2500&height=1667&name=Portal%20Drop%20Down%20(1)%20(1).png "Take a Tour of Adswerve Connect")
Share


Apps are amazing. They can bring you dinner, get you to work, and even help do your taxes. As people spend more time on phones and tablets, apps provide a way to reach potential customers without having to go to a store or even lift their heads. If you run a business or engage with consumers in any way, then you've probably thought about developing an app.
Putting an app into the marketplace can be a great way to increase consumer engagement; but if you don't implement tracking, then you won't be able to measure that engagement and quantify the success of your mobile marketing efforts. Thorough instructions on how to implement GA & GTM for mobile apps can be found in Google's
documentation
, but if you have more specific questions regarding implementation not answered in those guides, please feel free to comment!
While there are instructions that outline implementation, directions for analysts attempting to debug that implementation are not nearly as detailed. Noticing the disparity, we thought it might be helpful to provide some tips on how to get started debugging your in-app tracking implementation.
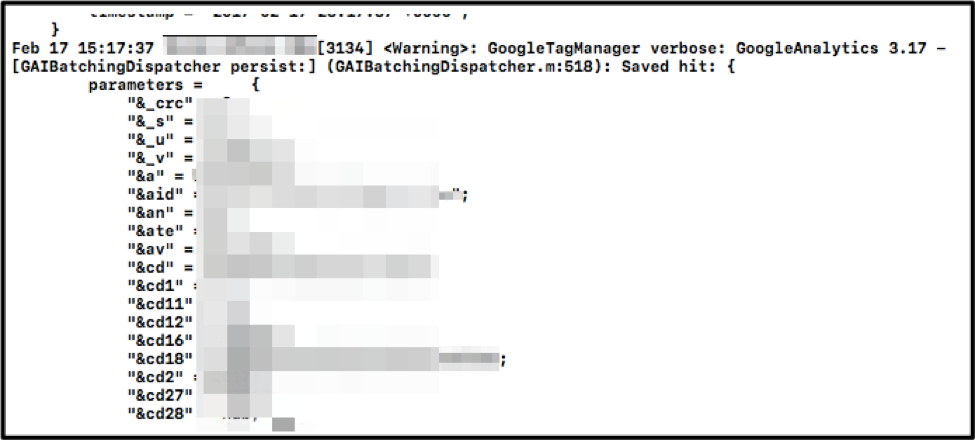 For a reference guide to the parameters in your logs, see
here
.
For a reference guide to the parameters in your logs, see
here
.
Where to Start
Device Logs
One of the keys to successfully debugging mobile GA/GTM implementations is finding a way to access the device logs while testing the app. This will allow you to see both the dataLayer pushes and the hit as the data is being sent to GA in real time. There are a number useful tools through which you can access mobile device logs for both android and ios implementations.- For iOS applications, we recommend either using XCode directly, Charles Web Proxy, or the device window in Console. Prior to accessing device logs, the development team will need to enable the environment variable "OS_ACTIVITY_MODE" in staging builds. Additional instructions for enabling logging can be found here for GA implementations and here for GTM.
- For Android builds, there is a relatively simple way to access device logs by inputting commands in Terminal. The process is outlined here.
- For both builds, we recommend that the development team log the contents of each dataLayer push. This allows visibility into the actual contents of each push and will help identify bugs.
For a reference guide to the parameters in your logs, see
here
.
Staging Property
There are a number of articles that recommend not sending any data to GA until after the application has been debugged. While that is definitely an option and will ensure your data's integrity, using a staging property can prove useful during the debug process. A staging property allows you to confirm the screen-view and event logs with the data as it shows up in GA's built-in real time reports. The data will be the same as what is seen in the logger, but the real time reports provide a helpful visual that will ensure nothing was missed while parsing through the device logs. Need help setting up a staging property? Contact APHow to Start
- Be Organized Evidenced by the example log pictured above, evaluating each hit and dataLayer push can be very difficult depending on the complexity of your app and how much data you are passing. That's why before you begin debugging, you should create a document detailing each element of your tracking implementation. You can then cross-reference this with the device logs during testing and make any necessary notes or observations.
- Test Everything Use this time to not only debug your analytics implementation, but your app as well. Make sure that your tracking is not impacting your app's functionality. Make certain every screen view and event is firing as intended and are configured correctly.
- Test it Again If you uncover an issue, try to recreate it. If you can't recreate it, chances are you don't fully understand it. Once you get to the bottom of the issue, then the proper correction can be identified and implemented.
- Move to Production Once you have successfully debugged the app and tracking is implemented correctly, move the data to the production property in Google Analytics. It is important to make sure the property settings are set to mobile app.