Measuring Movement With Universal Analytics

Subscribe to our monthly newsletter to get the latest updates in your inbox

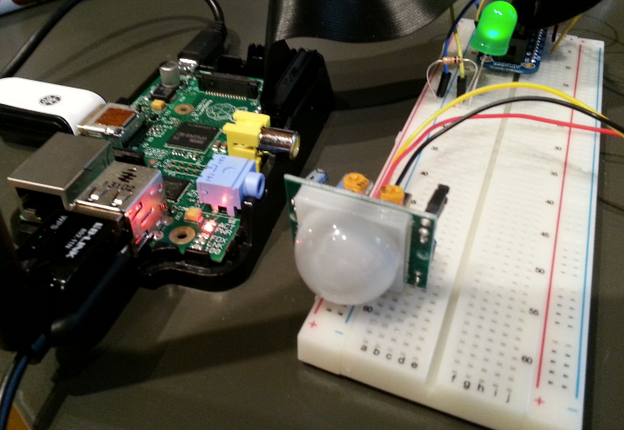
Universal Analytics is the new way to send Google Analytics. The beauty of Universal is that it can track user interactions from anywhere, including online and offline! As an analytics firm, we completely geek out when it comes to tracking new user interactions. One long standing question we had was: How much activity is there in our Seattle office during the day? This presented the challenge of accurately quantifying how many movement happened in our lobby on any given day. We wanted answers to several questions:
  1. When is foot traffic the highest?
  2. Was there foot traffic on the weekends?
  3. Why was foot traffic higher at certain times during the day?
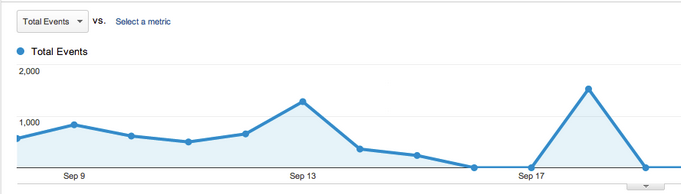
  4. Several times a year we have a booth at multiple tech conventions. We wanted to know how much traffic stops by our booth.
We decided the best solution would be to integrate tracking into a Raspberry Pi with a PIR sensor. A Raspberry Pi is a small computer that is able to hook into external sensors. The PIR sensor is an infrared sensor that senses infrared light radiating from objects passing by the sensor. The Raspberry Pi would track motion and then send each tracked piece of motion to Universal Analytics. See it in action. The challenge was to count visitors instead of just tracking each discrete tracked piece of motion. The solution to this problem was to debounce the tracked motion. In the code, we would count a new piece of motion as a visitor, but then wait 10 seconds to see if we registered a new set of motions.

Raspberry Pi Universal Analytics

  We started measuring visits into our Seattle office 9/8/2013. From the data, we can see a steady increase of movement leading up to 9/13/2013. I looked back at the calendar, and 9/13/2013 is a Friday. The data shows that our office is much more active on Friday than any other day of the week. Everyone is excited for the weekend and, ahem, there might have been a Nerf Gun battle that day.

Raspberry Pi UA graph

Notice that on Saturday and Sunday, 9/14/2013, there is a small amount of visitors. With our office empty on weekends, how could there be traffic? I did some investigation, and I found that the data was generated by the office cleaning crew on the weekends. Starting on 9/18/2013, we see another spike of heavy visitor movement to our BEST Boston Analytics conference. The visitors were measured moving in and out of the presentation hall of the conference. Seeing the visitor traffic on foot at the conference gave us an interesting insight on how many people were moving through the vicinity on particular days paired with the actual number of attendees. Before this experiment, I had no idea we had a cleaning crew on the weekends. It was fun being able to draw insights from the data to ask the questions: Why am I seeing traffic on the weekends? This was particularly interesting since I was not expecting traffic on the weekends. Universal Analytics is a very powerful platform. It can be used in any setting, on any device, and in any environment to gather valuable insights. Explore for yourself the tracking and integration possibilities with Universal Analytics, and feel free to use our Universal Analytics Protocol Libraries.