%20(1).png?width=2500&height=1667&name=Portal%20Drop%20Down%20(1)%20(1).png "Take a Tour of Adswerve Connect")
Share


 We just released a major update to our dataLayer inspector for Google Tag Manager and Google Analytics. Our add-on makes it significantly easier to debug, monitor and see detailed information without having to constantly rotate from the page to the page code and finally the developer console. Our extension lets you know:
- What is pushed to the Google Tag Manager dataLayer?
- What is sent to Google Analytics?
- When are these pushes happening?
- Are there issues?
- Simulate dataLayer pushes
- Work with GTM containers not deployed on a site
- Add code to the page before anything else happens
- Hide specific events
- Ignore hits to specific properties
- Or turn the clock back to simpler times (i.e. Classic Mode)
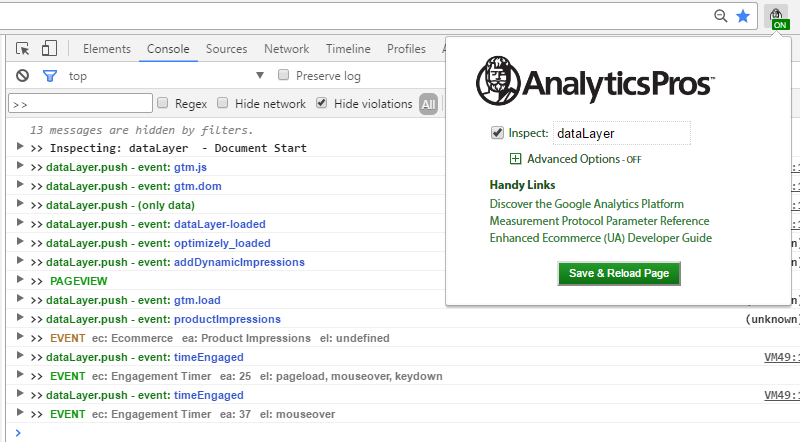
Using the Analytics Pros dataLayer Inspector+
First, add the extension to Chrome . Once added, you will be able to start inspecting the dataLayer by clicking on the extension icon in your address bar. Expanding the Advance Options will give you the ability to turn back time, and perform other magic.Monitor dataLayer pushes and hits
Inspecting the data
Pushes to the dataLayer Each dataLayer push is logged as a collapsed group to the console. Events are the most common and are labeled with event: <name>. Click on the arrow icon ► to expand the details and the Object key/value pairs. Included in the group are the pushed object, errors and warnings (if applicable), and timing information. BTW, you can hide the timing with advanced options.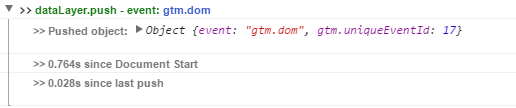 Hits sent to Google Analytics
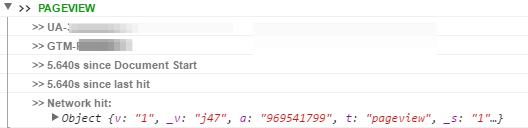
Typically a pageview, followed by events. The output will include the target property, the GTM container (if sent by GTM), timing, and the details of the network hit. You can expand the network hit to see all the data sent to GA by clicking on the arrow icon ►.
Hits sent to Google Analytics
Typically a pageview, followed by events. The output will include the target property, the GTM container (if sent by GTM), timing, and the details of the network hit. You can expand the network hit to see all the data sent to GA by clicking on the arrow icon ►.
Validation
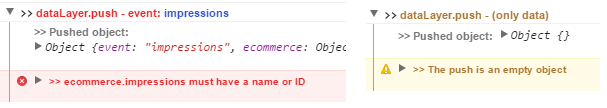
Since we all want a properly initialized dataLayer and well-formed dataLayer pushes, (who doesn't?), the dataLayer Inspector+ evaluates multiple aspects of the process:- Is the dataLayer initialized correctly?
- Are there multiple dataLayers?
- Is the push to the dataLayer valid?
- Is it a valid ecommerce object?
- Is the hit successfully delivered to Google Analytics?
- Was the hit redirected?
Advanced Options
Add to page Sometimes we need to add data, a container, or code to a page. When selected, these actions will happen very early in the page load process. dataLayer.push This option will push an object into the dataLayer immediately upon loading the Inspector, usually within a couple of milliseconds of the page starting to load. Insert GTM Container Selecting this option will add the specified GTM container to any pages that match the Host. The RegEx option can help ensure you only insert the container into the right pages or it can help you use the same container across multiple domains.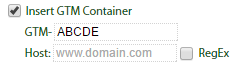 You will be able to tell if the container is inserted if the badge is visible in the top left-hand corner of the page. Clicking on the badge will show or hide the badge:
 Inject Code
This option allows you to add code to the page before any other code runs. This can be very helpful in debugging code on sites with code-related issues and you need to be there before GTM is loaded.
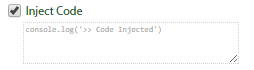
Inject Code
This option allows you to add code to the page before any other code runs. This can be very helpful in debugging code on sites with code-related issues and you need to be there before GTM is loaded.
Limit Output
Reducing the firehose of data can help focus on the important information. Hiding timing and internal directs are simple ways to reduce the data. In addition, we have a couple of filters that use RegEx to exclude the noise. Hide specific events pushed and/or sent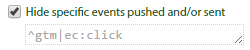 Use RegEx to filter events pushed to the dataLayer and hits. For pushes, the key "event" is evaluated and for hits, the event category "ec" is evaluated. For example:
- To exclude all "gtm" events, use "^gtm"
- To exclude hits with the category "click", use "ec:click"
- To exclude both, use ^gtm|ec:click"
Ignore hits to specific properties
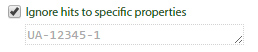 Sometimes sites have multiple properties receiving hits. When you want to focus on one, it's sometimes difficult to narrow down the activity. You can use RegEx to filter by account or by a specific property; e.g. a property: "UA-12345-1$" or an account: "UA-12345-".
Other Options
Classic Mode
Sometimes we want to go back to simpler times, when things were less complicated. By selecting Classic Mode , you can transport back to 2014, when a dataLayer push was just a dataLayer push.Wait for dataLayer
Analytics Pros dataLayer Inspector+ initializes the dataLayer using our recommended method; e.g. window.dataLayer = window.dataLayer || [ ]. Frequently, we see sites that initialize the dataLayer incorrectly; window.dataLayer = [ ]. The Inspector recognizes this, and will warn you. But even that is not enough. This feature was added so that we could use the Inspector+ on a site that initialized the data very uniquely; e.g. dataLayer = dataLayer || {pageDetails: …}. Go figure?Caveats and Cautions
Preserve Log and Object Life When objects are pushed to the console, a representation (often truncated) is displayed. The little arrow (►) shown, indicates the object can be expanded. At the time the object is expanded, it is evaluated by the console, showing the current value of the object in memory. When preserving the log for multiple pages, only the objects in the current page are in memory. So, if you want to compare objects pushed on one page, to those of another page when navigating, you will need to have both pages in memory. Ctrl or Cmd-click will bring up the new page in a new tab or window, where you can compare the two pages.Super helpful hint
Filter the console with >> Sometimes the console can get really cluttered with messages, especially when setting up analytics for a site in development, and the developers are flooding it with console messages and errors. To limit the console to only what is logged by the Inspector, filter the console with ">>". Every message from the inspector is pre-pended with ">>" so you will only see them.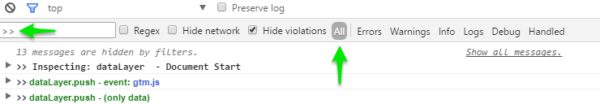 P.S. Make sure you have "All" selected, otherwise you will not see all the output.