%20(1).png?width=2500&height=1667&name=Portal%20Drop%20Down%20(1)%20(1).png "Take a Tour of Adswerve Connect")
Share


Google recently
announced their
Cloud Datalab platform. Datalab is a powerful data exploration tool built on top of Jupyter (formerly and better known as iPython). If you have any experience with iPython notebooks or are at least somewhat familiar with Python this should be a very exciting news for you. You can run new or transfer existing notebooks and have the power of Google Cloud behind it. Datalab comes with an out-of-the-box integration with Big Query and Google Charts, which enables you to query, manipulate and visualize raw Google Analytics data faster than ever on top of Google Cloud Platform. Beside the basic Jupyter functionality Datalab also offers a great way of collaboration through its Git integration. In this post we'll look at a neat sample notebook that comes with the Datalab. It explains step by step how to connect to the Google Analytics BigQuery data and how to import it and visualize it using Google Charts. To start your instance of Datalab, visit
https://datalab.cloud.google.com/ and deploy it to one of your Google Cloud Projects. The deployment process takes a few minutes. When a Datalab instance is deployed you will be given an appspot.com link through which you will be able to access it. Access permissions are handled through the Google Cloud Console. Once you are successfully able to open your Datalab application, go through the following steps to acquaint yourself with some of the possibilities it has to offer:
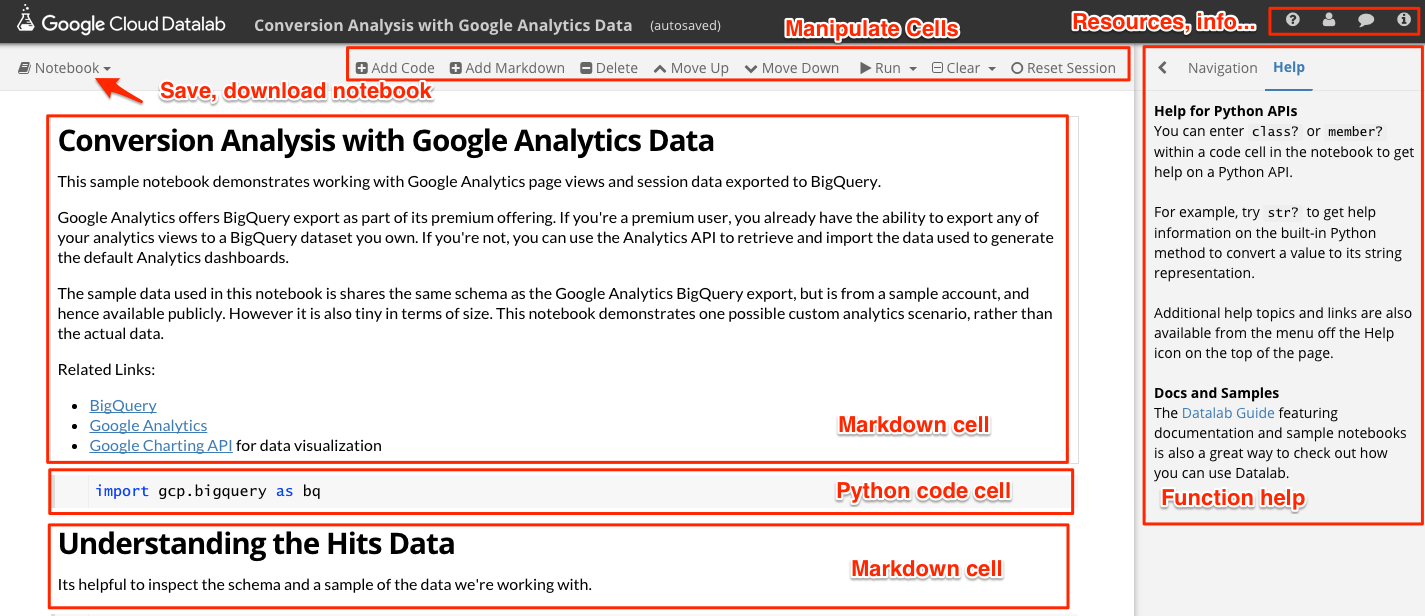
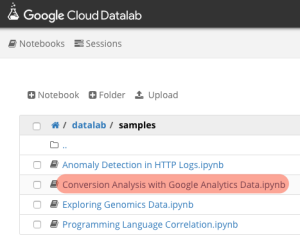
- In your Google Cloud Datalab navigate to "/datalab/samples/" and open the "Conversion Analysis with Google Analytics Data" notebook.
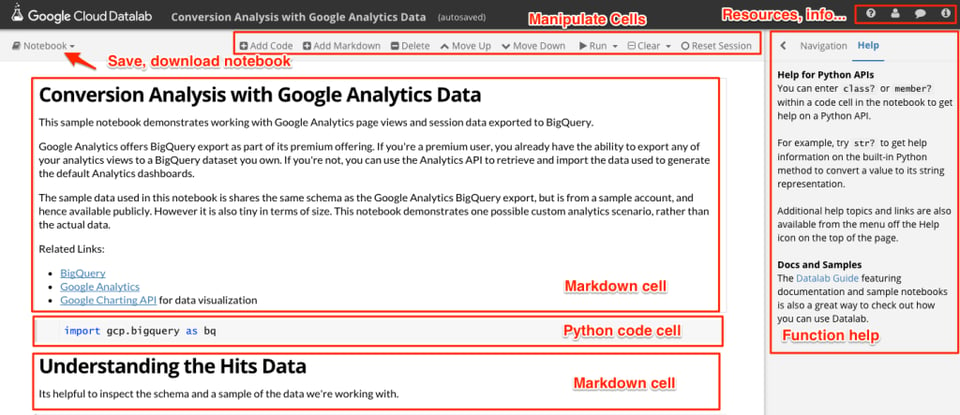
- A typical notebook will be constructed out of:
- Markdown cells - used to display styled text
- Python code cells - which can be executed by pressing ctrl+enter on Windows or cmd+enter on Macintosh
- Help - used to describe Classes or Objects
- Other navigation items
- In the sample notebook we can see how easy it is to import and query the BigQuery schema and display the results inside the notebook. The following two lines of code inside a Python cell, will import the BigQuery library and display schema of our table inside the notebook.
import gcp.bigquery as bq %%bigquery schema --table "google.com:analytics-bigquery:LondonCycleHelmet.ga_sessions_20130910"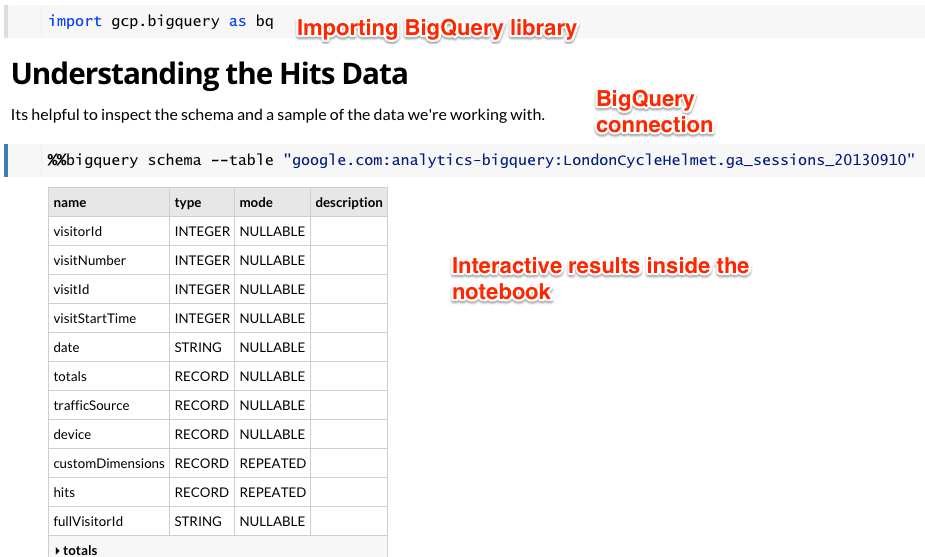
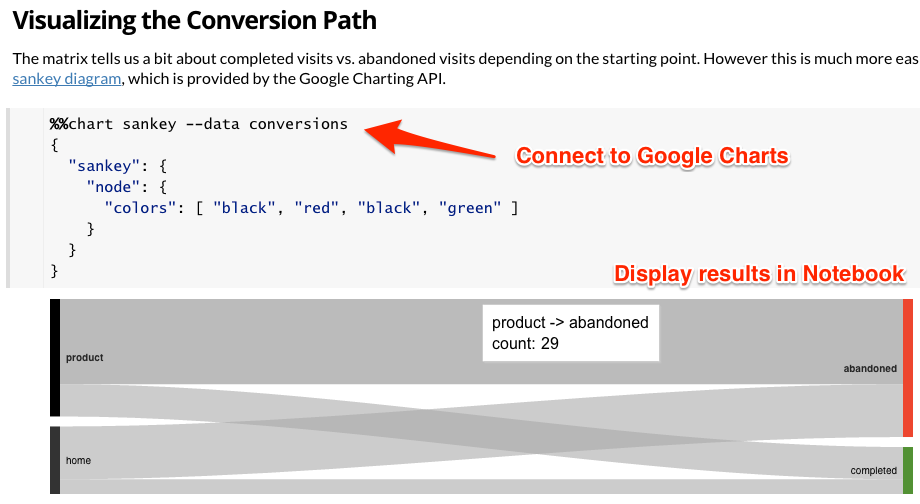
- In the final Python cell of the notebook you can see how easy it is to display the data that was queried and analyzed into any Google Chart or matplotlib visualization.