Share


What is DoubleClick for Publishers (DFP)?
DFP is a way for publishers to manage their ads across multiple sources and channels, in short, an Ad server. DFP is similar to AdSense, which only serves Google’s Ad Exchange (Adx) bought ads, but with different rules, terms of service and flexibility to serve ads from other ad networks (besides Adx) along with any direct buys. With DFP, you're able to serve Adx along with many other ad networks and have them bid against each other. This allows for a concept of header bidding. Header bidding is a programmatic technique where publishers offer inventory (ad slots) to multiple ad exchanges simultaneously before making calls to their ad servers. This technique has generated a huge lift in revenue for digital publishers.What are the benefits of linking DFP to Google Analytics?
You can only link DFP to a Google Analytics 360 account. With that caveat, there are two main benefits to linking DFP to GA 360.- Page level and traffic type reporting on metrics such as revenue
- DFP & GA Audience Sharing
Reporting Benefits and implications
DFP reporting in the DFP user interface allows you to see RPM and revenue by ad slot. While this is handy, it doesn’t go far enough.- Have you ever wondered how much revenue or RPM a single piece of content makes?
- Have you thought about using RPM and revenue to influence what type of content you write or which author to assign to a particular piece of content?
- Do you have multiple marketing channels or use multiple Facebook pages to promote your content?
- Do you know which channel or page actually produces the highest amount of revenue or highest RPM?
- Do you work with an affiliate network and wonder if each partner’s audience are worth the same as another’s?
The Basics
Where in Google analytics does this data live?
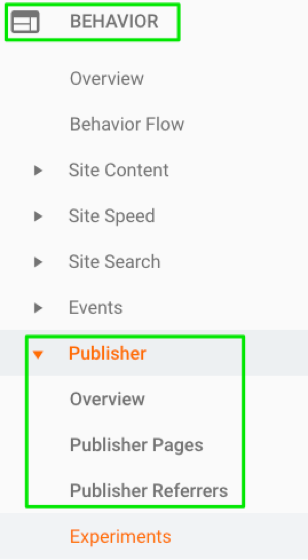
There are three different reports within Google Analytics. These can be found within the Behavior Reports section of the left navigation under the Publisher section.- Publisher Overview Report – A high-level summary of key publisher focused metrics
- Publisher Pages Report – Pages on your site that contributed the most to DFP impressions
- Publisher Referrers Report – The domains that contributed the most DFP impressions to your site
DFP Specific Metrics in Google Analytics
Linking DFP and GA introduces 10 new metrics. These are similar to the metrics introduced when you link Adsense or Ad Exchange. Here they are:- DFP Impressions – A DFP ad impression is reported whenever an individual ad is displayed on your website. For example, if a page with two ad units is viewed once, we'll display two impressions.
- DFP Coverage – Coverage is the percentage of ad requests that returned at least one ad. Generally, coverage can help you identify sites where your DFP account isn't able to provide targeted ads. (Ad Impressions / Total Ad Requests) * 100.
- DFP Monetized Pageviews – Measures the total number of pageviews on your property that were shown with an ad from your linked DFP account. Note: a single page can have multiple ad units.
- DFP Impressions / Session – The ratio of DFP ad impressions to Analytics sessions (Ad Impressions / Analytics Sessions).
- DFP Viewable Impressions % – The percentage of ad impressions that were viewable. An impression is considered viewable when it has appeared within a user’s browser and had the opportunity to be seen.
- DFP Clicks – The number of times DFP ads were clicked on your site.
- DFP CTR – The percentage of DFP impressions that resulted in a click on an ad.
- DFP Revenue – DFP revenue is an estimate of your total ad revenue based on impressions served.
- DFP Revenue / 1000 Sessions – The total estimated revenue from DFP ads per 1000 Analytics sessions. Note that this metric is based on sessions to your site and not ad impressions.
- DFP eCPM – The estimated cost per thousand page views. It is your DFP Revenue per 1000 pageviews.
Publisher Overview Report
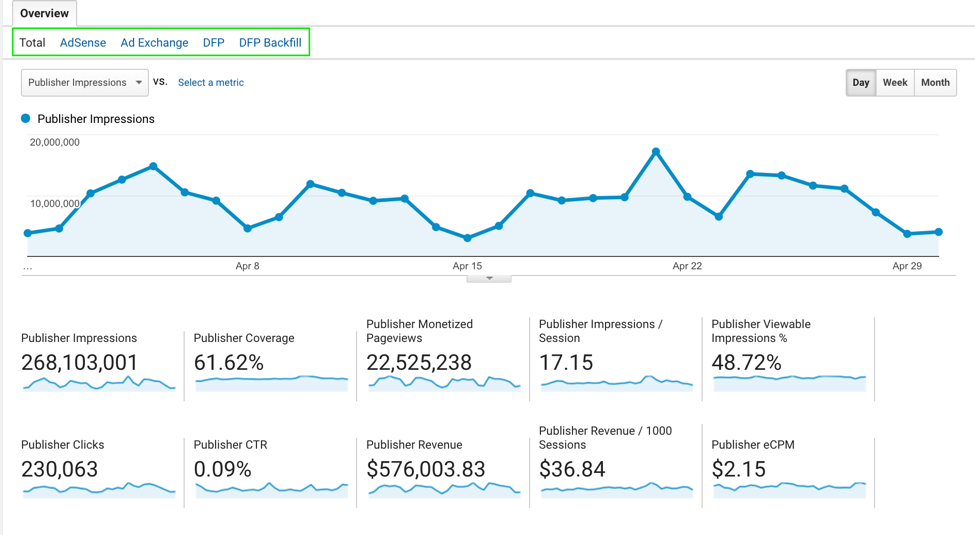 If you've linked AdSense and Ad Exchange, as well as DFP, you will have 5 different selections to choose from on the top report groups indicated in the green box above.
- Total is the sum of all linked ad networks.
- AdSense are ads served directly from the AdSense network.
- Ad Exchange are ads served directly from the Ad Exchange network.
- DFP Backfill: If AdSense and Ad Exchange are managed through DFP, they will appear under the DFP Backfill metric.
- DFP: All other ads served direct through DFP will be reported on under the DFP report.
Publisher Pages Report
The Pages report provides data about which pages on your site contributed the most DFP impressions. By default, the graph displays the daily total DFP impressions for your site; the table displays total DFP metrics for the date range distributed by page.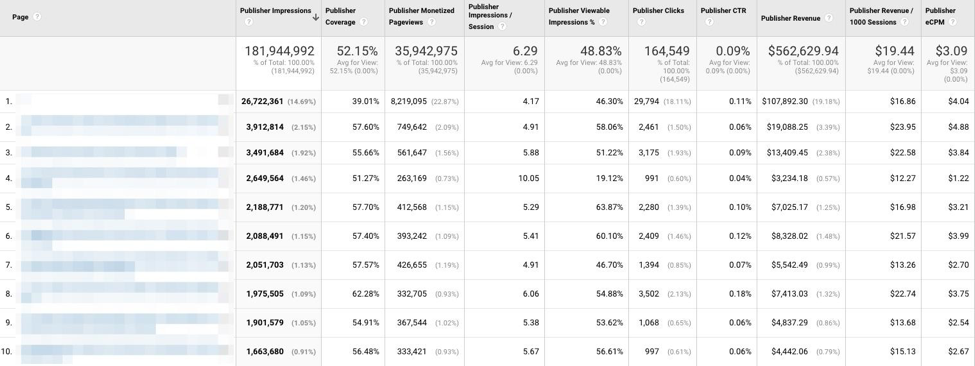 Here we can see how each article or story performs from both a total revenue perspective or from an eCPM perspective. This can help influence what types of content you write about (but remember good content is good content regardless of topic).
Publisher Referrers Report
The Publishers Referrers report displays the domains that contributed the most DFP impressions to your site. The graph displays the daily total DFP impressions for your site; the table displays total revenue metrics for the date range distributed by referring domain. In the table, click a domain name to see metrics per referring page. Above the table, click the different viewing options under Primary Dimension to see metrics by source or medium.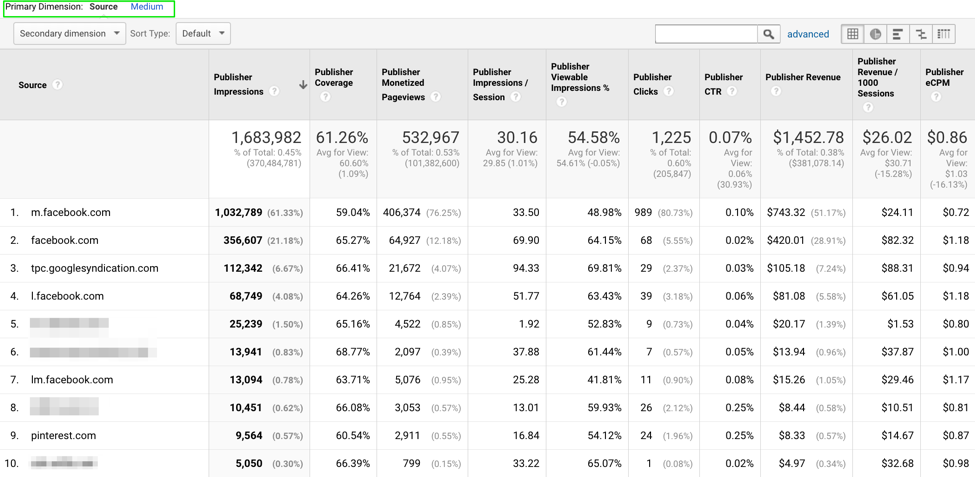 Here we can see how each referral source contributes to the total revenue and each eCPM of each referral source. You can also change the Primary Dimension to medium but in this case it should only return referral.
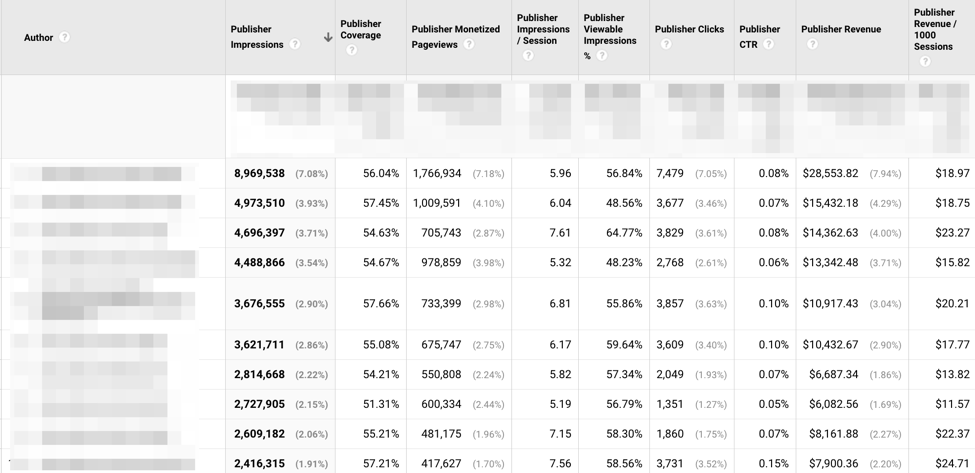
One of the questions we wanted to answer above was how well each author does. To do this, author will have to be passed in as a custom dimension. Once you have that, you can build a custom report to see how well each author performs, in terms of total revenue, publisher coverage, and RPM.
Here we can see how each referral source contributes to the total revenue and each eCPM of each referral source. You can also change the Primary Dimension to medium but in this case it should only return referral.
One of the questions we wanted to answer above was how well each author does. To do this, author will have to be passed in as a custom dimension. Once you have that, you can build a custom report to see how well each author performs, in terms of total revenue, publisher coverage, and RPM.
Audience Sharing
Using DFP Audience , you can create an audience in Google Analytics of “high value users” or “highly engaged users” and share that audience to DFP to increase monetization opportunities. You can also create audiences based on what type of content a user tends to read to create a custom audience that allows advertisers to target line items relevant to that audience segment. This type of targeting provides a better advertising experience for site users and can increase conversions for advertisers, which will raise a publisher’s revenue per 1,000 pageviews (RPM).Creating Custom Audiences
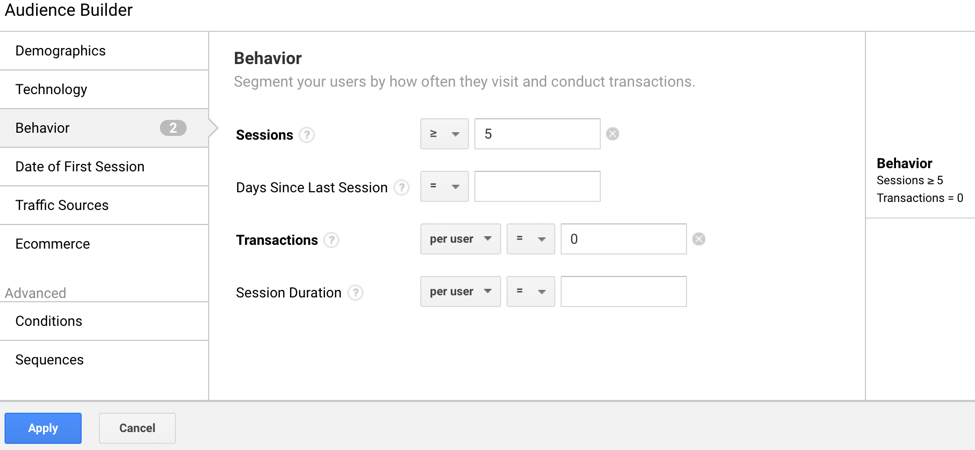
To create a custom audience, go to the Admin section of Google Analytics. At the Property level, select Audience Definitions and then select Audiences.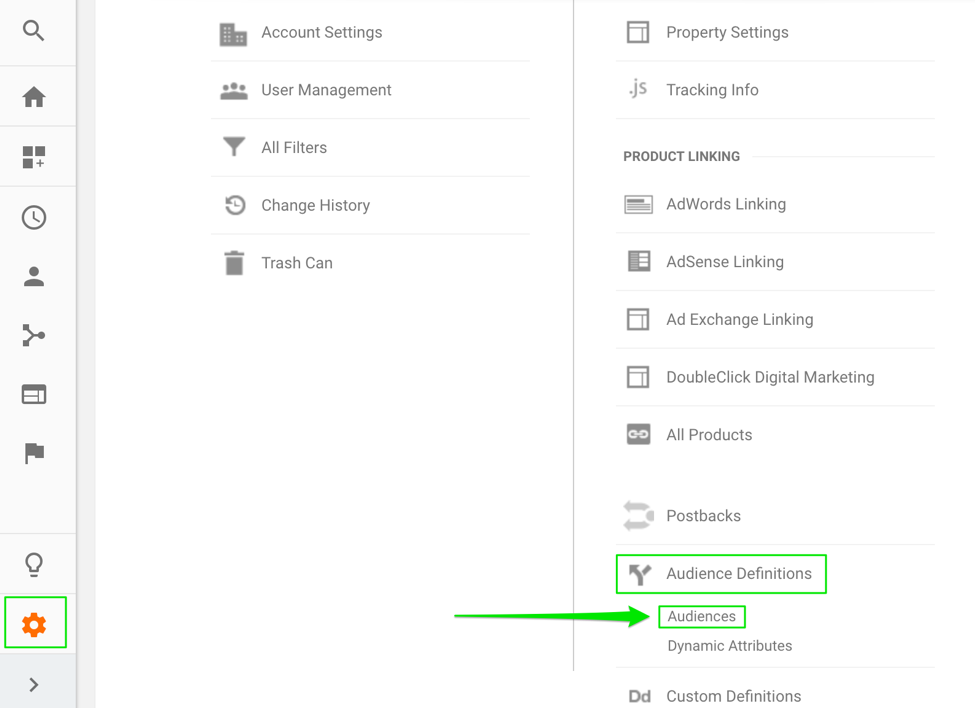 Next, click to create a New Audience, which will give you a screen that should look familiar if you have used custom segments at any point.
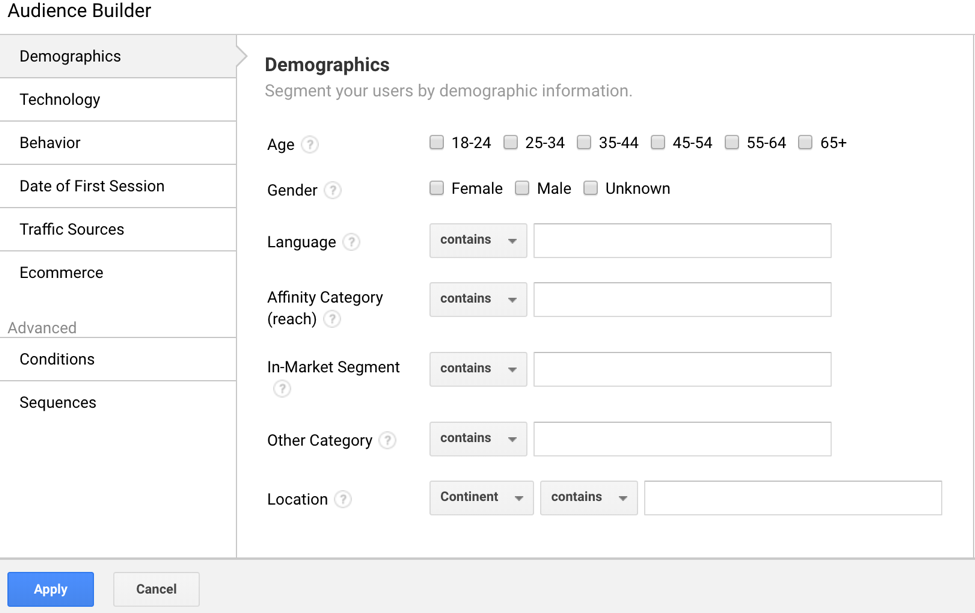 Here, we can create a segment of people who had at least 5 sessions within the selected date range and have not converted into a paid user.
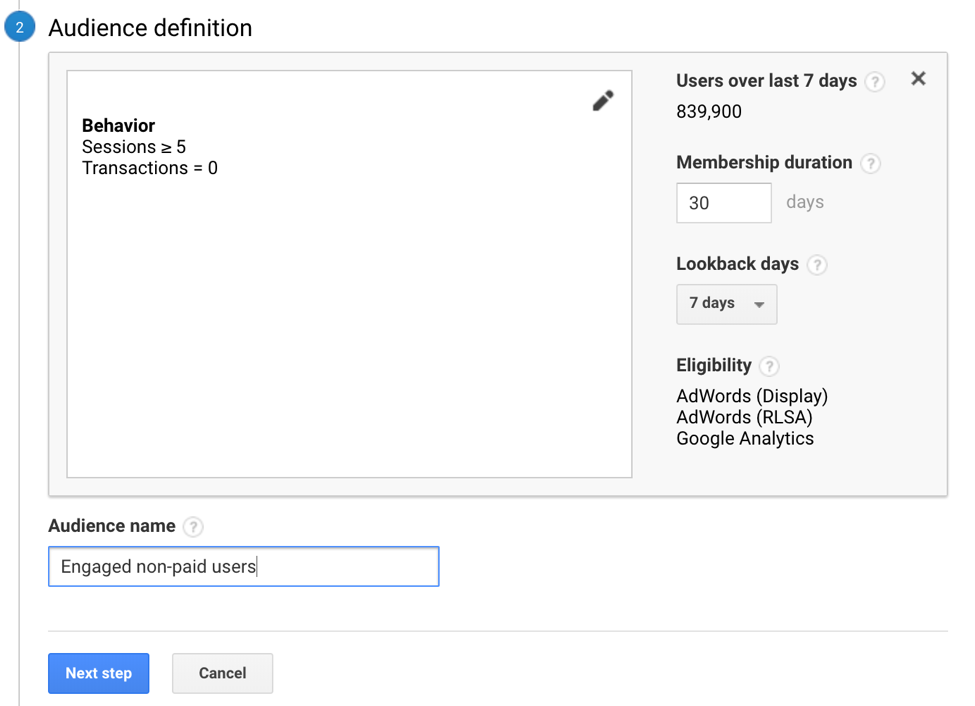
 Once we apply this audience, Google will show the amount of users over the last 7 days, membership duration, lookback days, and which accounts are eligible to be shared to. You will want to give this audience a meaningful name. In this example, we named our audience “Engaged non-paid users”.
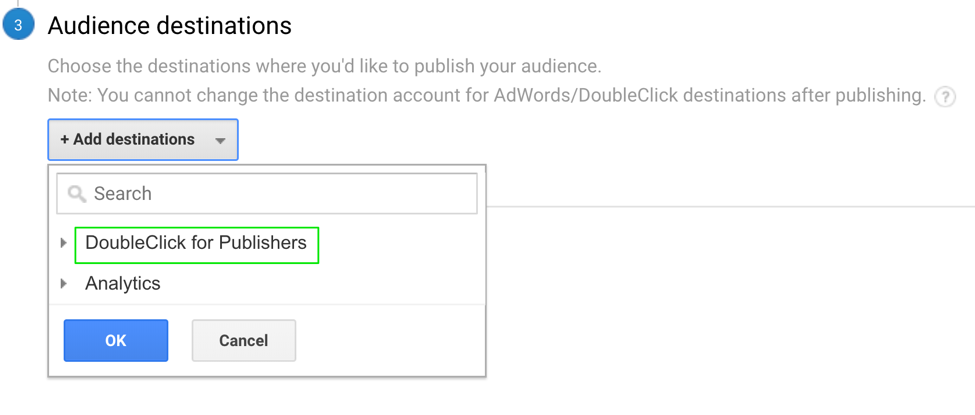
 The final step is to add the destination account you want to share your new audience with!
 The options here are endless. Depending on your business model, each audience you build and add to DFP can have huge effects on your revenue.