%20(1).png?width=2500&height=1667&name=Portal%20Drop%20Down%20(1)%20(1).png "Take a Tour of Adswerve Connect")
Share


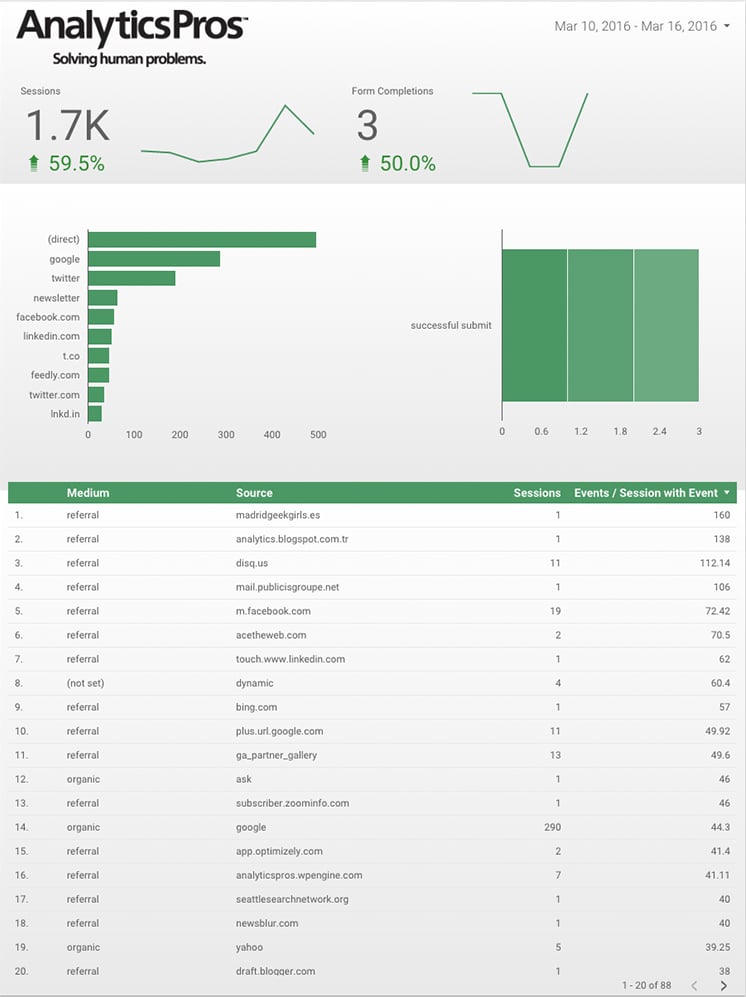
Historically, reporting in Google Analytics has been limited to either the native reports, custom reports in the user interface, or extracting the data and using an external tool. While we've all become accustom to these options, none of them were particularly ideal.
Data Studio 360 is the reporting tool from Google we've all been waiting for. It brings a native report building option to Google Analytics with all of the features of Google Docs (sharing, multi user editing, etc.). Additionally, Data Studio 360 brings control to creating the look and feel that most brands need.
 Additional Data sources are also available. Once you have identified the data you need, one of the very powerful features is the ability to attach the data to the report. This allows for users with access to the report to use and interact with the report, without requiring them to have access to all of the source data.
This feature brings incredible power to the ability to share just the data you want to share with multiple users—without the need of exposing all of your data to that user. Multiple data sources can be tied to single report, allowing for adjustment on a per visual element basis. If you need to report on Google Analytics data and Big Query data in a single report, you now have the flexibility to do so. An example of where this can be very useful is in prototyping of a dashboard/report. You can use the native Google Analytics connection to get the visual reference you need, then switch over to Big Query once it has been approved, write the custom query to use the native connection, and leverage that unsampled big query data. This allows for iteration and improvement on the same report, with minimal to no visual change once it is approved.
Additional Data sources are also available. Once you have identified the data you need, one of the very powerful features is the ability to attach the data to the report. This allows for users with access to the report to use and interact with the report, without requiring them to have access to all of the source data.
This feature brings incredible power to the ability to share just the data you want to share with multiple users—without the need of exposing all of your data to that user. Multiple data sources can be tied to single report, allowing for adjustment on a per visual element basis. If you need to report on Google Analytics data and Big Query data in a single report, you now have the flexibility to do so. An example of where this can be very useful is in prototyping of a dashboard/report. You can use the native Google Analytics connection to get the visual reference you need, then switch over to Big Query once it has been approved, write the custom query to use the native connection, and leverage that unsampled big query data. This allows for iteration and improvement on the same report, with minimal to no visual change once it is approved.
 With other reporting packages formatting and alignment can be difficult. Data Studio 360 makes much of this formatting easy through a suite of controls for alignment and styling. Once you have a design on a visual element you like, you can also simply copy and paste that element, change the data source, and you are all set, consistent formatting across all similar data elements.
 Filtering visuals and controlling the data, for example the date range for a specific visual, is easy to do. Maybe you only want to look at events for a specific category, or have a goal based reporting widget that is on a fixed timeframe—the controls on a per element basis make this possible and easy.
 Not unique to Data Studio 360, but something we always like to be aware of, is query cost. The ease at which Data Studio 360 brings analysts to Big Query means a greater potential for more queries being written. While this is great for analysis and data usage, it also can mean rising Big Query costs. With Google Analytics 360, there is currently a Big Query credit that certainly helps mitigate any worries over cost, but it is always something to be aware of.
Control Over Data Sources
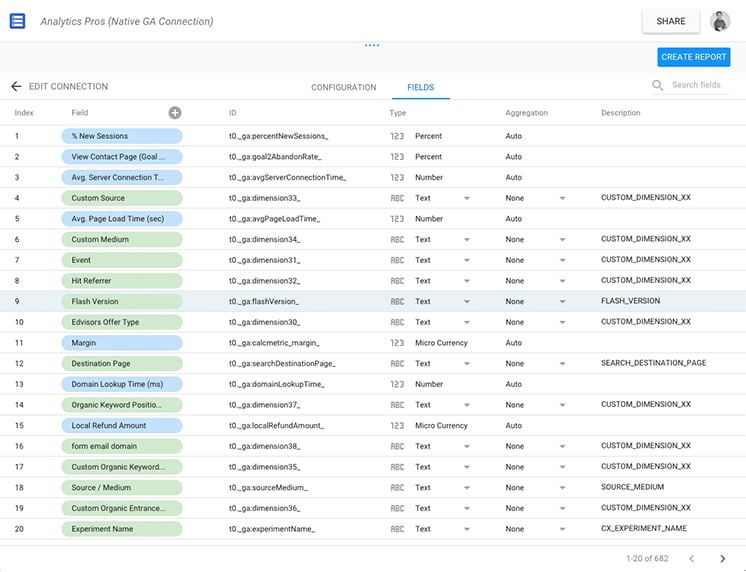
There are multiple ways to bring data into Data Studio 360, with the most familiar being the Native Google Analytics connection. However, as we are seeing with many clients, the needs for working with Big Query is increasing exponentially. The Big Query connection options enable any level of analyst to get started reporting right out of the bigdata set. With Big Query there is both a native connection (similar to Google Analytics) and the ability to write custom Queries. Additional Data sources are also available. Once you have identified the data you need, one of the very powerful features is the ability to attach the data to the report. This allows for users with access to the report to use and interact with the report, without requiring them to have access to all of the source data.
This feature brings incredible power to the ability to share just the data you want to share with multiple users—without the need of exposing all of your data to that user. Multiple data sources can be tied to single report, allowing for adjustment on a per visual element basis. If you need to report on Google Analytics data and Big Query data in a single report, you now have the flexibility to do so. An example of where this can be very useful is in prototyping of a dashboard/report. You can use the native Google Analytics connection to get the visual reference you need, then switch over to Big Query once it has been approved, write the custom query to use the native connection, and leverage that unsampled big query data. This allows for iteration and improvement on the same report, with minimal to no visual change once it is approved.
Visual Control
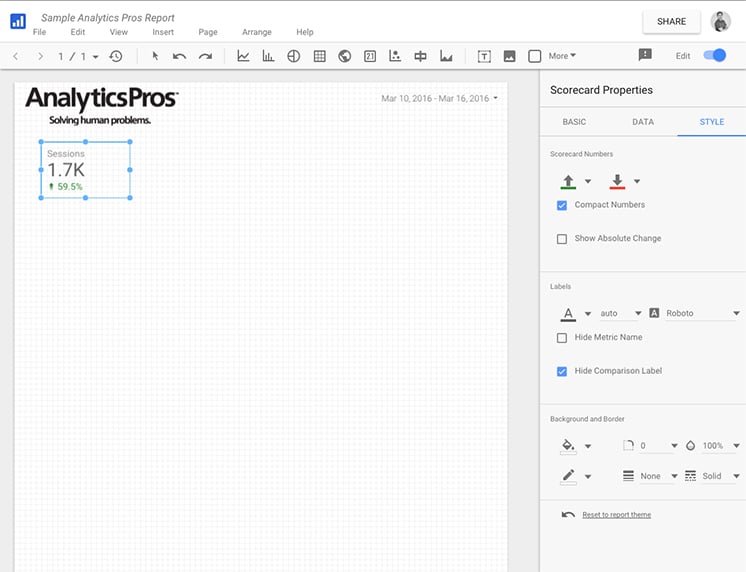
The look and feel of a report is often critical to adoption within an organization. Creating the right visual elements makes consumption of the data faster and easier to use. With multiple visualization options, the report creator has the ability to select the right visual or visual combination to portray the data effectively. Additionally, within each visual there are controls over color, style, and other formatting. This enables you to use the color palates your users or brand require. With other reporting packages formatting and alignment can be difficult. Data Studio 360 makes much of this formatting easy through a suite of controls for alignment and styling. Once you have a design on a visual element you like, you can also simply copy and paste that element, change the data source, and you are all set, consistent formatting across all similar data elements.
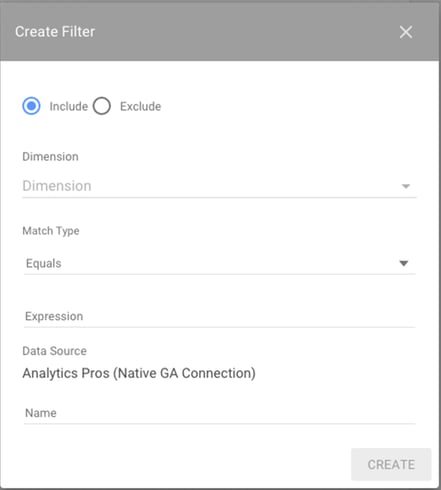
Working with Each Element
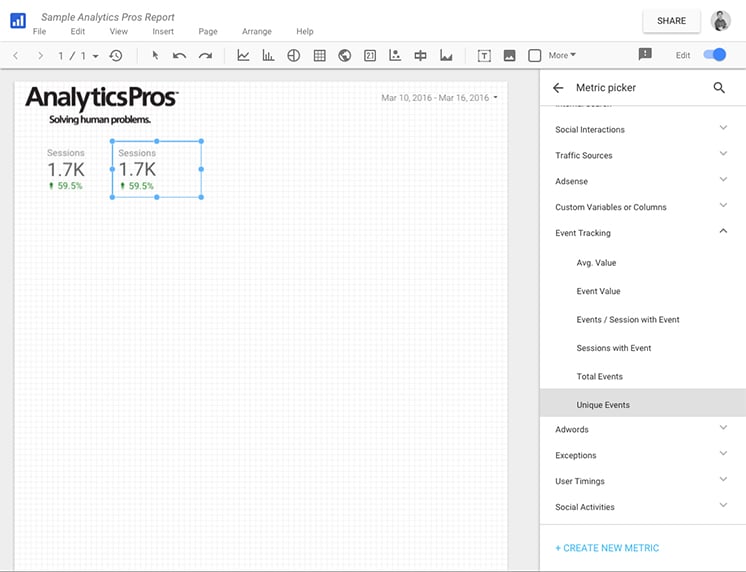
Each element can be controlled and worked with independently. From selecting the data source to creating filters on the widget, you have ultimate control on a per element basis. This allows for great controls over both data and visual styling as needed. Filtering visuals and controlling the data, for example the date range for a specific visual, is easy to do. Maybe you only want to look at events for a specific category, or have a goal based reporting widget that is on a fixed timeframe—the controls on a per element basis make this possible and easy.
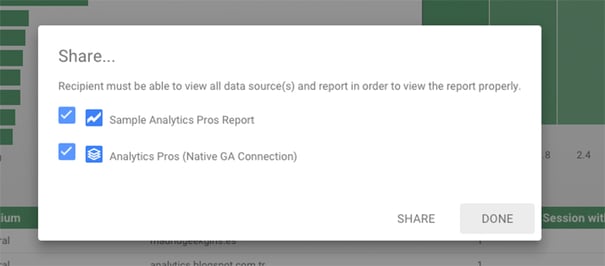
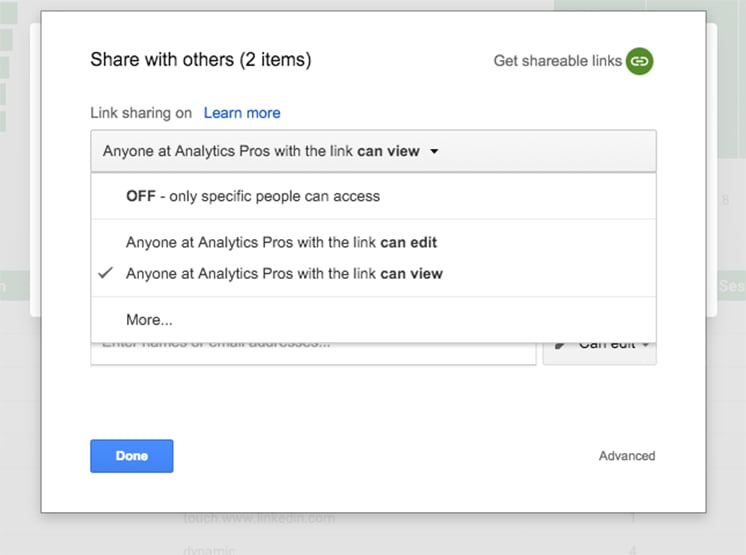
Sharing
Sharing is as easy in Data Studio 360 as it is with all Google Docs. The sharing options are the same once you have selected what you want to share. If you create an amazing report that someone may want to use a template, you can share just the report and they can select their own data sources. Need to share the report and associated data? You can do that too.
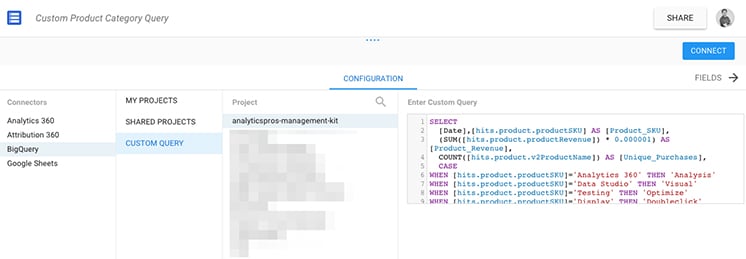
Working with Big Query
In our evaluation so far, most of the work has been with Big Query. The ability to work natively within Data Studio 360 using big query data brings unsampled performance and query writing to analysts not familiar with SQL. Additionally, those that are familiar with SQL can now work directly with Big Query to get the output needed for each connection efficiently and easily. There are some limitations that hopefully the data studio team works through. For example, the date selector works great but functionally all in report controls work as an outer select on the inner query. For those un familiar this means the date range will only work within the limits of the original query setup, so your original query needs to either have all data, or be updated at the data source level with a new date range set as needed. Not unique to Data Studio 360, but something we always like to be aware of, is query cost. The ease at which Data Studio 360 brings analysts to Big Query means a greater potential for more queries being written. While this is great for analysis and data usage, it also can mean rising Big Query costs. With Google Analytics 360, there is currently a Big Query credit that certainly helps mitigate any worries over cost, but it is always something to be aware of.