%20(1).png?width=2500&height=1667&name=Portal%20Drop%20Down%20(1)%20(1).png "Take a Tour of Adswerve Connect")
Share


Google Analytics 360 has recently launched an exciting addition to their toolbox of analytics tools. That addition is called,
Advanced Analysis
. With it comes the ability to take the reporting of your Google Analytics data even further by being able to dig in and explore your data rather than just reporting on your KPI’s. In addition to digging into analysis options, it also makes taking action on your data easy and straightforward. Through great analysis and actionability, Advanced Analysis in Google Analytics should be a welcome addition to your Google Analytics workflow!
Before diving into the different analysis techniques within Advanced Analysis, let’s talk about some of the general functionalities and capabilities of this tool. Each technique utilizes segments, dimensions, and metrics that you add—by simply dragging and dropping—to be utilized within your analysis. This makes running your analysis both quick and user-friendly as any user is able to begin working with this tool very quickly. In addition to the ease of dragging and dropping the values you want to analyze, Advanced Analysis has the ability to add multiple tabs to your Analysis thus allowing for multiple techniques within a single analysis report. Each analysis technique has the option to build a segment or audience on a subset of the users within your analysis report, along with going straight to the User Explorer report in Google Analytics to take a closer look at those users.
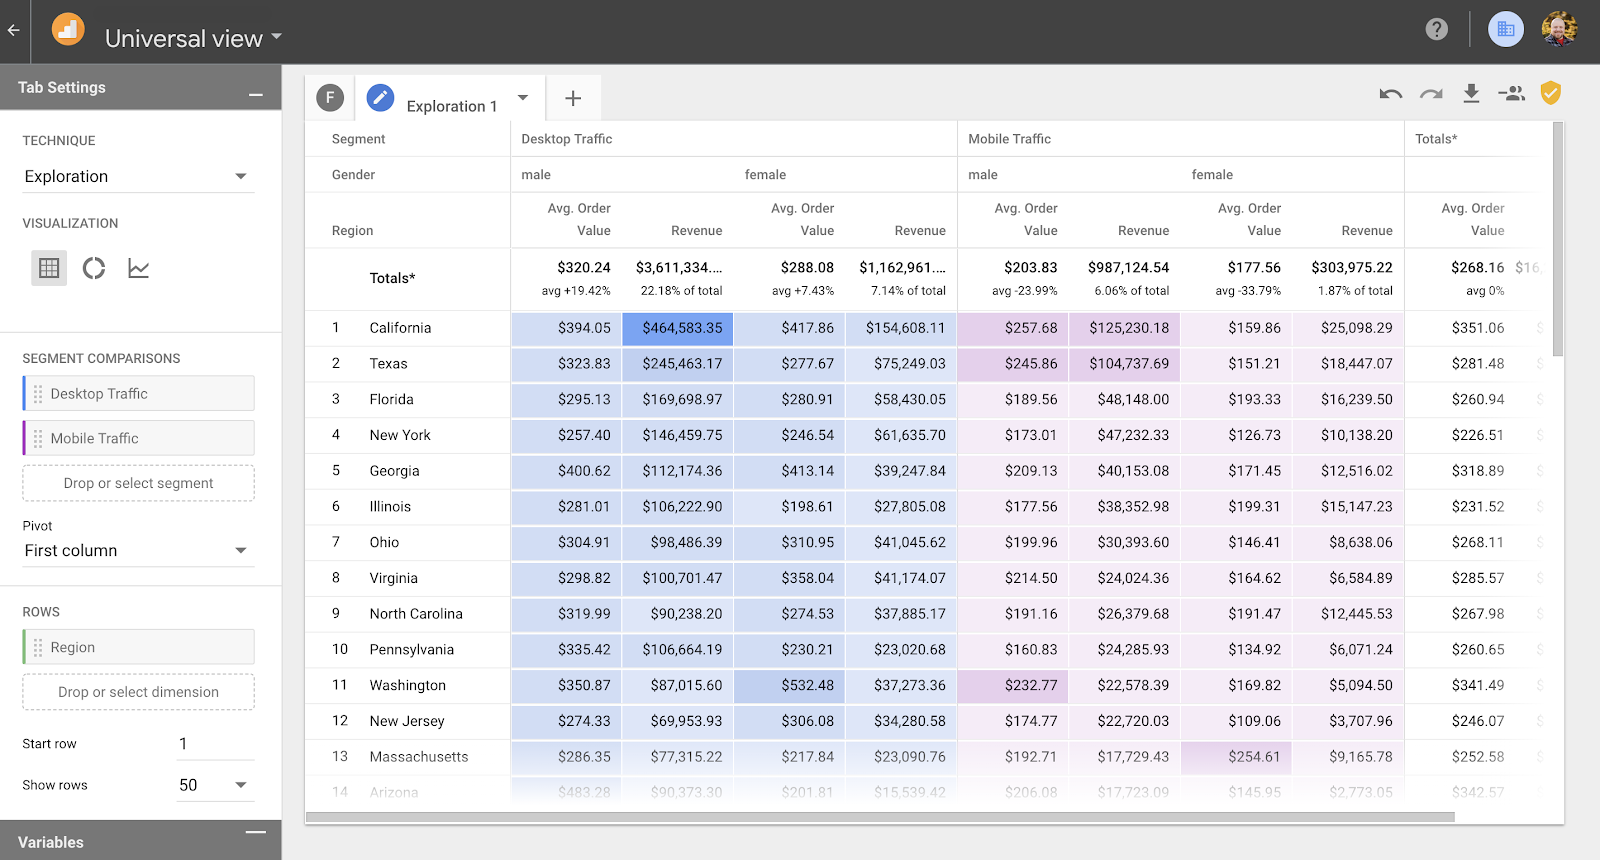 The table exploration tool allows you to place your dimensions on both columns and rows, with your “values” (metrics) laid out upon the table for you to see. For your metrics, you can choose to show them one of three ways: plain text, bar chart, or heat map. In addition to your dimensions and metrics, you can layer your segments on top of these columns and rows by choosing how you want your segments to pivot upon your data.
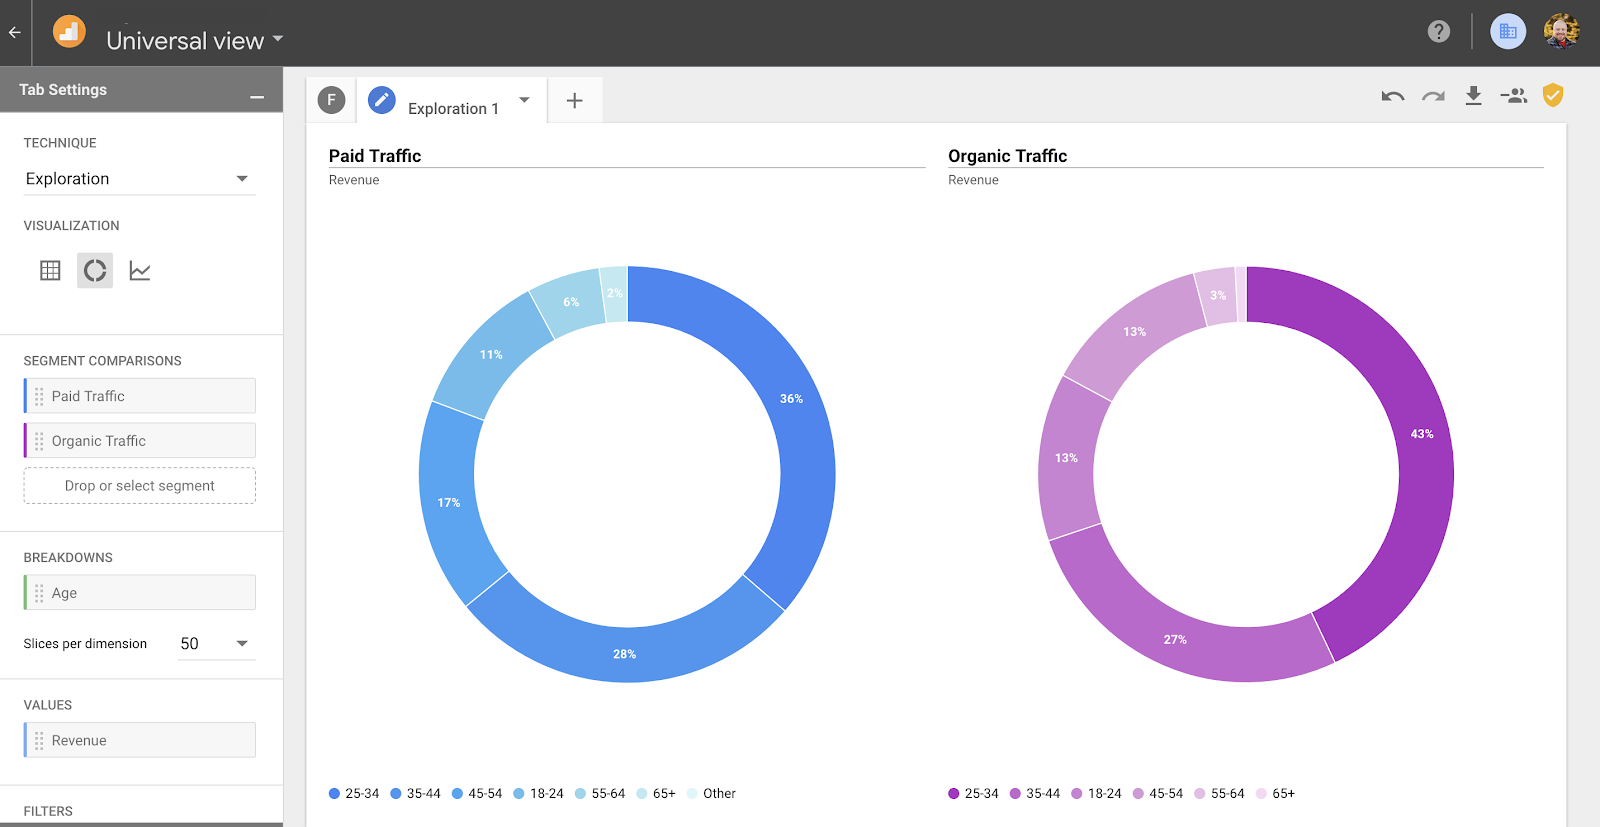 You can use the doughnut chart to visualize the percentage breakdown of your users and their relevant metrics. With the doughnut chart, you can place a metric and a breakdown dimension within the visualization. You can also add segments to see if the data varies per segment of users.
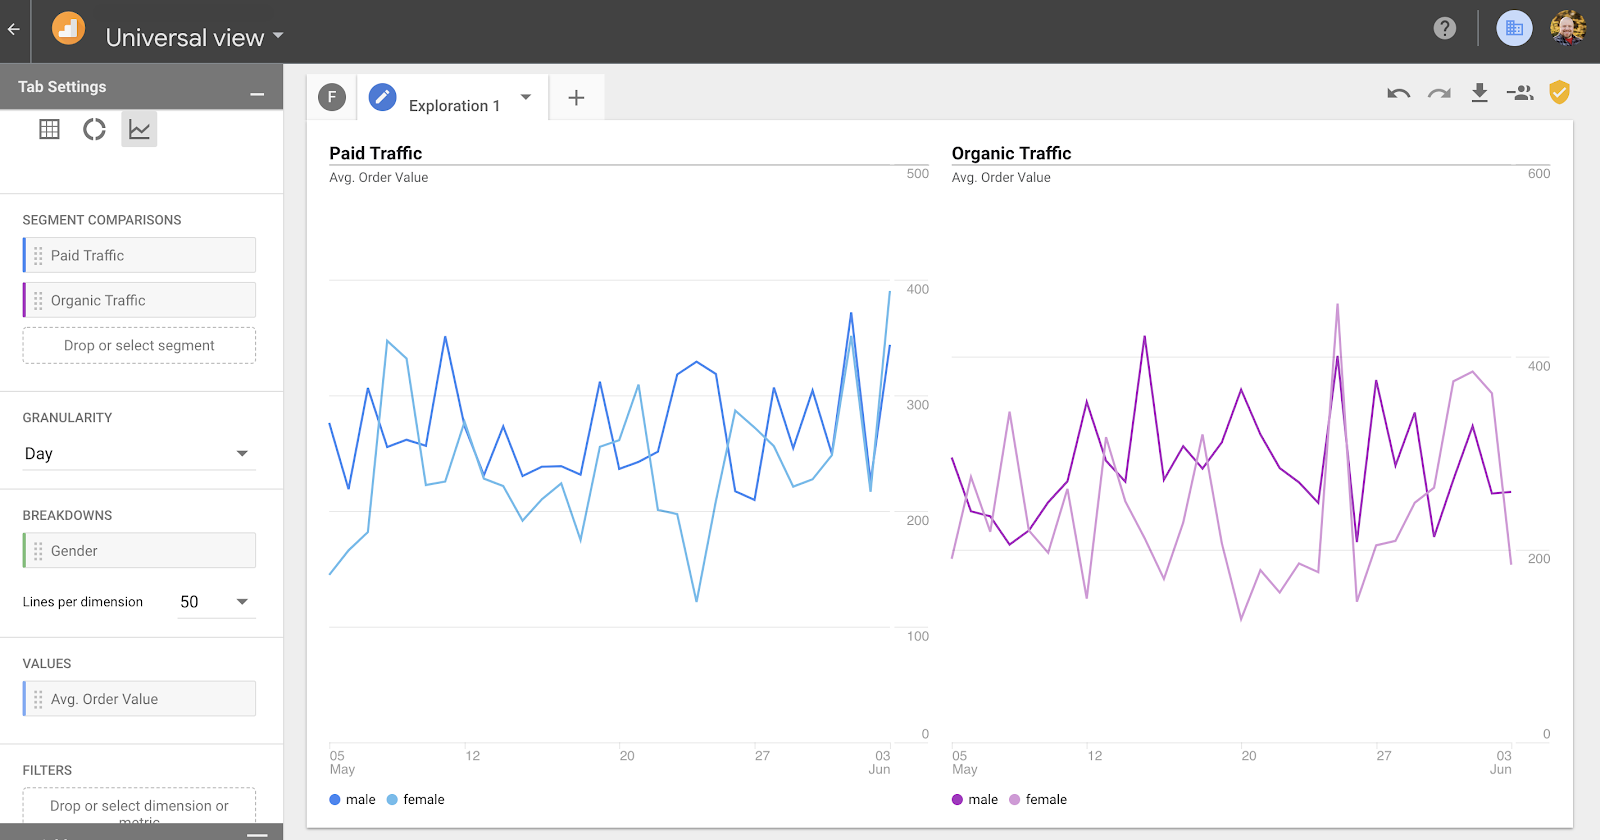 Like the doughnut chart, the time series visualization allows you to choose a breakdown dimension and a metric to see your data trended over time. Again, like the doughnut chart, the time series visualization displays your two segments side by side to better understand the comparison of your segments.
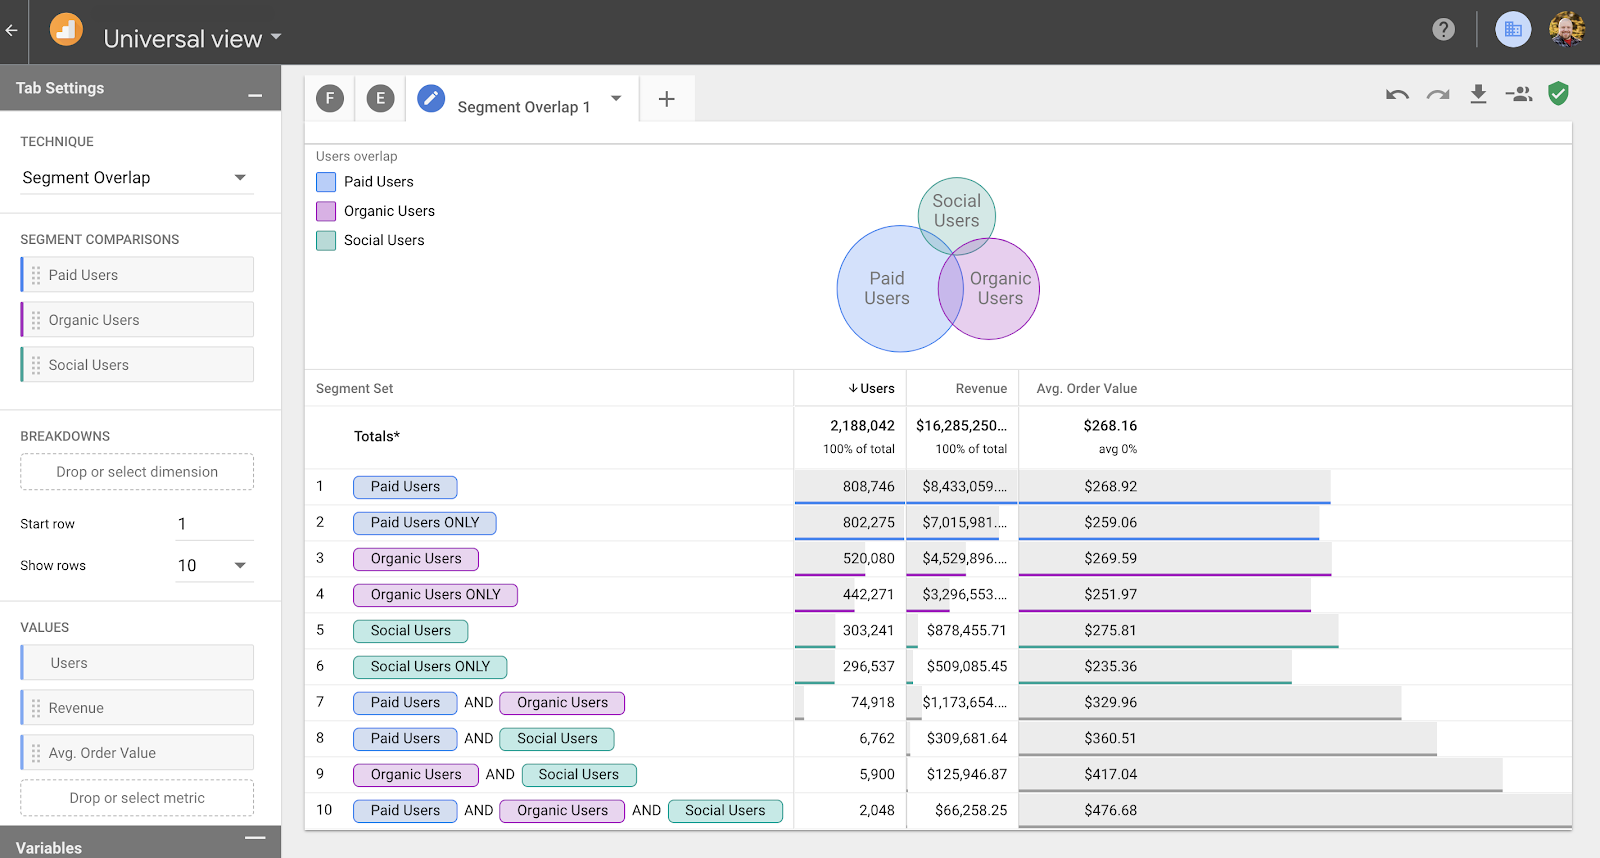 Advanced Analysis’ Segment Overlap tool allows you to see users from different segments of your audience as they intersect with each other. You can view up to three segments at a time to see the relationship between different user sets. In addition to being able to see the relationship of the users to each other, you can add metrics to the table below your visualization to understand the value of each user set (as well as the overlap of these user sets). This provides you with a great understanding of your users and the various segments they're part of.
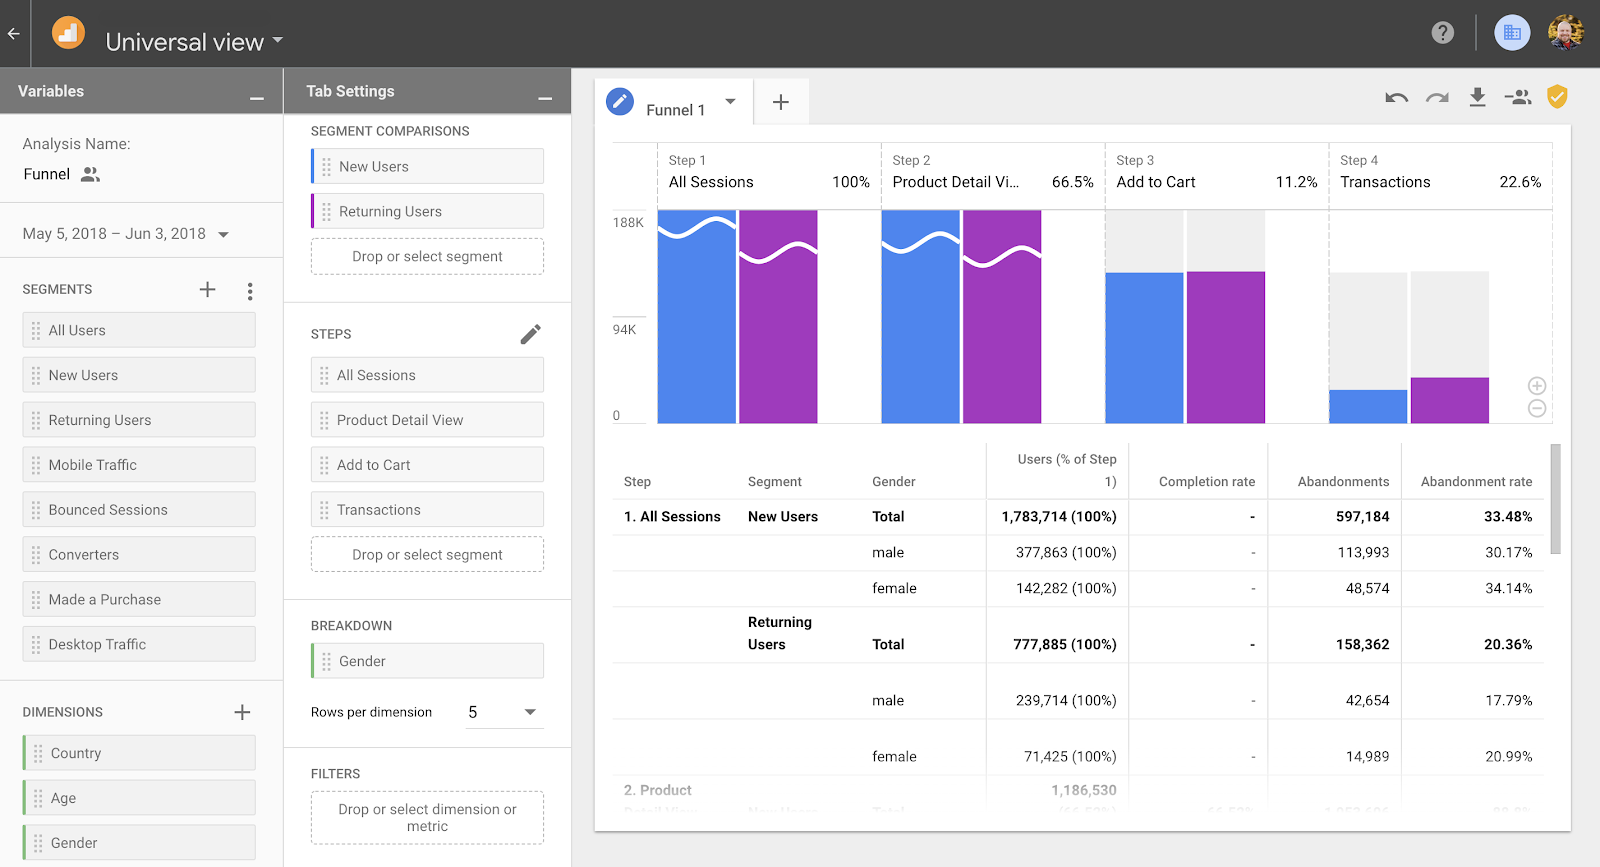
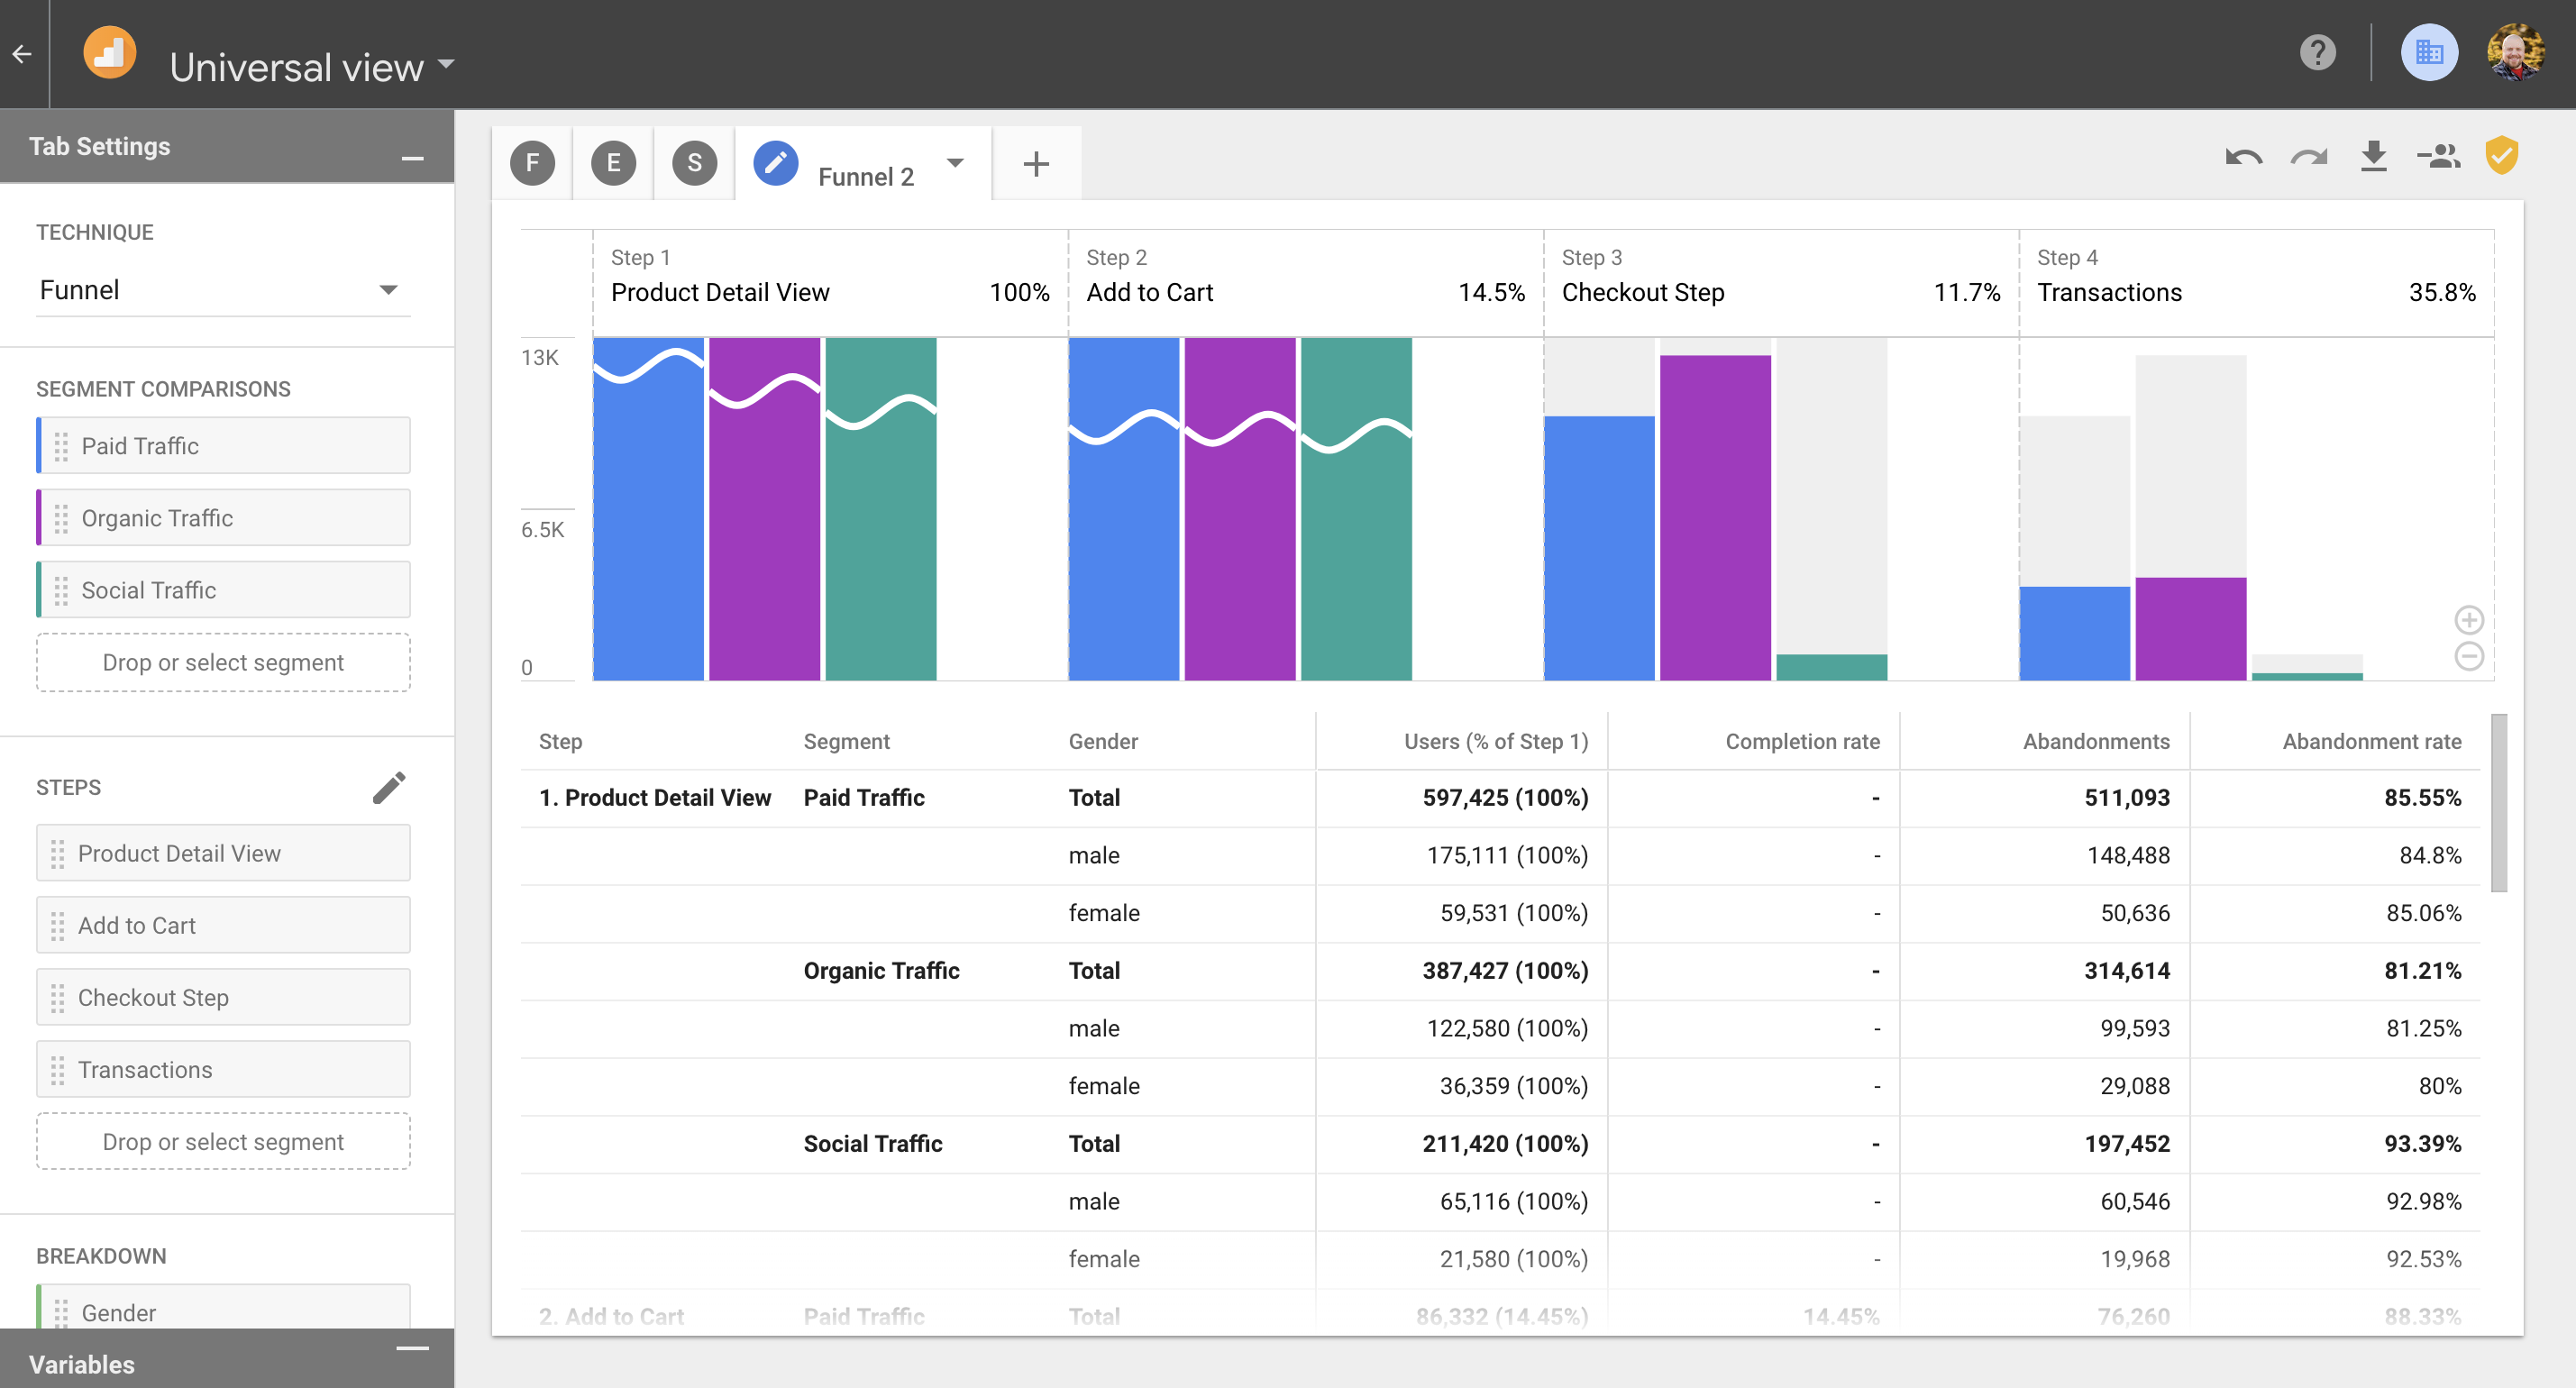 The Funnel analysis technique allows us to understand, retroactively, how users progress through a given funnel that we can define. This analysis technique can be defined by up to 10 steps in our funnel in order to understand the flow of our users. Not only are you able to see the segments of your users and how they continue through or abandon your funnel, the funnel analysis gives the ability to add a breakdown dimension. This breakdown dimension allows you to understand the rate at which users complete or exit each funnel step.
It's important to remember at this point that Advanced Analysis allows you to not only analyze your data but also to act. For example, in the Funnel analysis technique, you can take a subset of your users at a given stage and either build a segment or audience of those users.
The Funnel analysis technique allows us to understand, retroactively, how users progress through a given funnel that we can define. This analysis technique can be defined by up to 10 steps in our funnel in order to understand the flow of our users. Not only are you able to see the segments of your users and how they continue through or abandon your funnel, the funnel analysis gives the ability to add a breakdown dimension. This breakdown dimension allows you to understand the rate at which users complete or exit each funnel step.
It's important to remember at this point that Advanced Analysis allows you to not only analyze your data but also to act. For example, in the Funnel analysis technique, you can take a subset of your users at a given stage and either build a segment or audience of those users.
 This addition is important because the value of analysis is not simply understanding our users in a better way but understanding those users in a way that leads toward action. The option to build a segment of your users that you can place back within GA or to build an audience which can be sent to Google AdWords, DoubleClick, or Google Optimize allows you to take the understanding you’ve gained through Advanced Analysis and retarget or test against those specific users to see greater results within your efforts!
Hopefully this introduction to Google’s new Advanced Analysis has spurred you to take hold of the data available in Google Analytics to further understand your users and turn that understanding into action and results!
This addition is important because the value of analysis is not simply understanding our users in a better way but understanding those users in a way that leads toward action. The option to build a segment of your users that you can place back within GA or to build an audience which can be sent to Google AdWords, DoubleClick, or Google Optimize allows you to take the understanding you’ve gained through Advanced Analysis and retarget or test against those specific users to see greater results within your efforts!
Hopefully this introduction to Google’s new Advanced Analysis has spurred you to take hold of the data available in Google Analytics to further understand your users and turn that understanding into action and results!
Exploration
The Exploration technique lets you utilize a few different visualization options in order to explore your data within Advanced Analysis. You can view your data with a table, a doughnut chart, or a time series graph.
The table exploration tool allows you to place your dimensions on both columns and rows, with your “values” (metrics) laid out upon the table for you to see. For your metrics, you can choose to show them one of three ways: plain text, bar chart, or heat map. In addition to your dimensions and metrics, you can layer your segments on top of these columns and rows by choosing how you want your segments to pivot upon your data.
You can use the doughnut chart to visualize the percentage breakdown of your users and their relevant metrics. With the doughnut chart, you can place a metric and a breakdown dimension within the visualization. You can also add segments to see if the data varies per segment of users.
Like the doughnut chart, the time series visualization allows you to choose a breakdown dimension and a metric to see your data trended over time. Again, like the doughnut chart, the time series visualization displays your two segments side by side to better understand the comparison of your segments.
Segment Overlap
Advanced Analysis’ Segment Overlap tool allows you to see users from different segments of your audience as they intersect with each other. You can view up to three segments at a time to see the relationship between different user sets. In addition to being able to see the relationship of the users to each other, you can add metrics to the table below your visualization to understand the value of each user set (as well as the overlap of these user sets). This provides you with a great understanding of your users and the various segments they're part of.
Funnel
The Funnel analysis technique allows us to understand, retroactively, how users progress through a given funnel that we can define. This analysis technique can be defined by up to 10 steps in our funnel in order to understand the flow of our users. Not only are you able to see the segments of your users and how they continue through or abandon your funnel, the funnel analysis gives the ability to add a breakdown dimension. This breakdown dimension allows you to understand the rate at which users complete or exit each funnel step.
It's important to remember at this point that Advanced Analysis allows you to not only analyze your data but also to act. For example, in the Funnel analysis technique, you can take a subset of your users at a given stage and either build a segment or audience of those users.
This addition is important because the value of analysis is not simply understanding our users in a better way but understanding those users in a way that leads toward action. The option to build a segment of your users that you can place back within GA or to build an audience which can be sent to Google AdWords, DoubleClick, or Google Optimize allows you to take the understanding you’ve gained through Advanced Analysis and retarget or test against those specific users to see greater results within your efforts!
Hopefully this introduction to Google’s new Advanced Analysis has spurred you to take hold of the data available in Google Analytics to further understand your users and turn that understanding into action and results!