%20(1).png?width=2500&height=1667&name=Portal%20Drop%20Down%20(1)%20(1).png "Take a Tour of Adswerve Connect")
Question 1: Do Higher QB Ratings Usually Win Games?
[caption id="attachment_7211" align="alignleft" width="375"]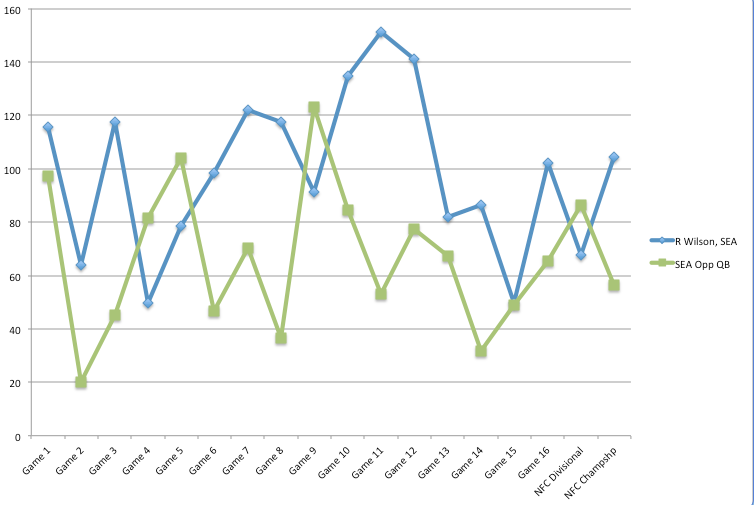 Russell Wilson v Opposing Quarterbacks in the 2013 NFL season. Russell Wilson in blue. Opposition in green.[/caption] To test Nick Saban’s assertion that the football team with the higher QB rating usually wins the game, I looked at all 16 regular season and 2 post-season games of the 2013 Seattle Seahawks.
In 12 of those 18 games (or 66.7%), the team with the higher QB rating won the game.
As many of you already know, Russell Wilson had a fantastic 2013 campaign and was the higher-rated passer in 14 of 18 Seahawks games, as shown in the graph below. Given this overwhelming evidence, I’ve concluded that Nick Saban is correct when he states that the team with the higher rated QB usually wins.
Russell Wilson v Opposing Quarterbacks in the 2013 NFL season. Russell Wilson in blue. Opposition in green.[/caption] To test Nick Saban’s assertion that the football team with the higher QB rating usually wins the game, I looked at all 16 regular season and 2 post-season games of the 2013 Seattle Seahawks.
In 12 of those 18 games (or 66.7%), the team with the higher QB rating won the game.
As many of you already know, Russell Wilson had a fantastic 2013 campaign and was the higher-rated passer in 14 of 18 Seahawks games, as shown in the graph below. Given this overwhelming evidence, I’ve concluded that Nick Saban is correct when he states that the team with the higher rated QB usually wins.
Question 2: Does Defense Win Championships?
Next, I needed to assess whether the mantra “Defense Wins Championships” is in fact true. Where would be the best place to scour data to determine whether or not this statement is accurate? Oh yes, nowhere other than the prior 47 Super Bowl games. On the biggest stage, the Super Bowl team with the best defense won 29 of the 47 games (or 61.7%). Further, the #1 overall defense in NFL has played in the Super Bowl 21 times, winning 16 times (or 76.2%), which further solidifies that Defense does IN FACT win championships. Anyone familiar with college football, can look at the prior 7 BCS championships that the SEC won primarily due to its staunch defenses. All of this bodes well for the 2013 Seattle Seahawks, the current overall #1 defense in the NFL.So, which team is better, the 2013 Seattle Seahawks or the 2005 Seattle Seahawks?
Coach
To begin comparing the teams, I chose to start with the head man: Pete Carroll vs. Mike Holmgren. I picked 5 statistics that I felt were best indicative of quality coaching:- Overall Win/Loss record (Winning %)
- Win/Loss record in the playoffs (Playoff Winning %)
- Number of Super Bowl wins
- Net Penalty Differential
- Net Turnover Margin
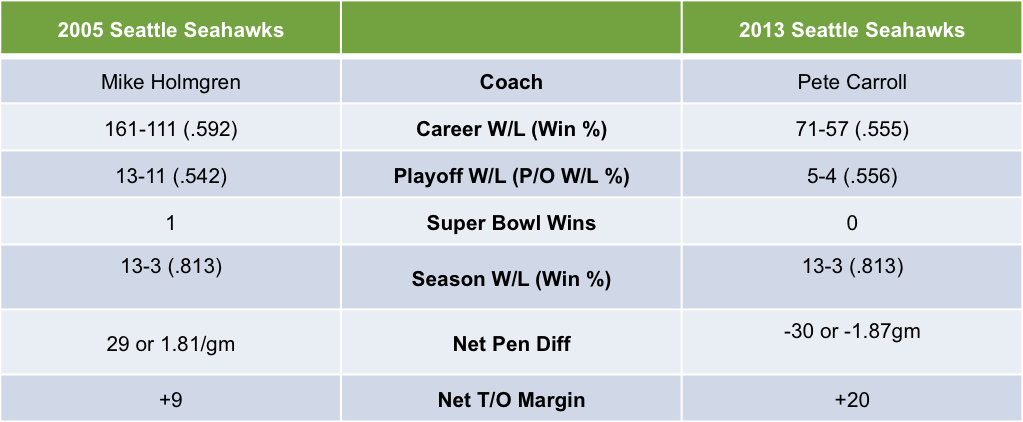
 Not surprising, the tale of the tape is very close. Holmgren has the edge in overall winning percentage and net penalty differential, while Carroll has a slight edge in playoff winning percentage and net turnover margin. However, the big (dare I say super) difference between Holmgren and Carroll is that Holmgren has won a Super Bowl. It’s quite possible that Pete Carroll could pull even with Holmgren this Sunday, but ahead of the game, I have to give Mike Holmgren the advantage for winning the big game. ADVANTAGE: 2005
Quarterback
As we said earlier, the QB with the higher QB rating usually wins the game. Russell Wilson had an excellent 2013 season. Given he is only two years into his NFL career, Seahawks fans have much to look forward to as he continues to mature his game. That said, Matt Hasselbeck was no slouch either and neither was the 2005 Seattle Seahawks offense. To compare the QB’s, I analyzed:- QB Rating
- Total Team Points
- Touchdown to Interception Ratio
- Total Passing Yards
- Total Offense NFL Ranking
- Scoring Offense NFL Ranking
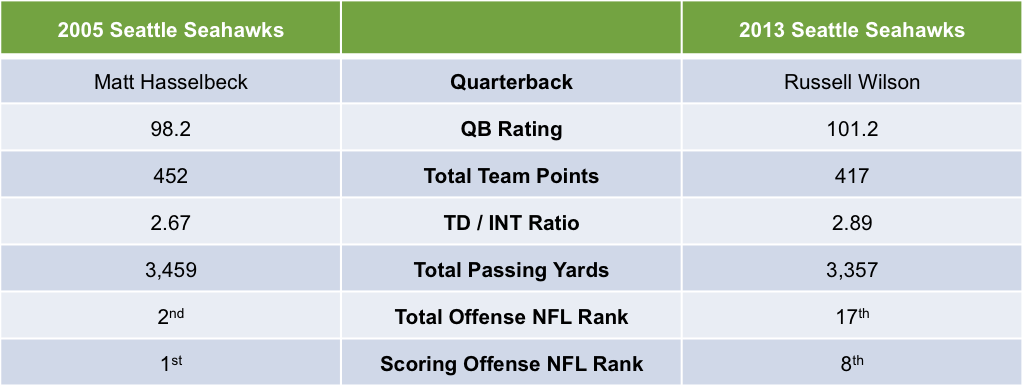
 At first blush, it looks like Russell Wilson is the easy choice. However, I did not remember the 2005 Seattle Seahawks led the NFL in scoring. In terms of pure passing, Russell Wilson has an exceptional QB Rating (avg. NFL QB Rating is 83.2 since 2008) and a very good Touchdown to Interception Ratio, while Hasselbeck threw for more yards and his team scored more points and gained more overall yards. Without giving away the next analysis, Hasselbeck had quite a bit of help on the 2005 team; so, on a pure QB to QB comparison, I have to give Russell Wilson a slight nod over Matt Hasselbeck. ADVANTAGE: 2013
Runningback
While I would take both of these running backs in a heartbeat, there is a clear winner in this category. To compare Shaun Alexander and Marshawn Lynch, I looked at:- Number of Touchdowns
- Total Rushing Yards
- Yards per Carry
- Number of 100+ Yard Games
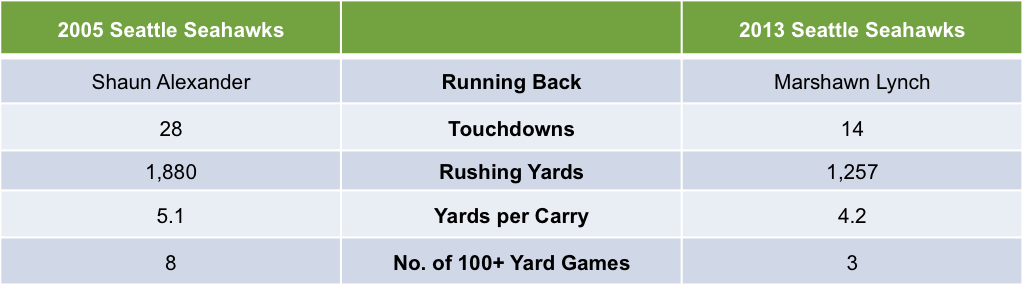
 Many Seattle Seahawks will remember the special year that Shaun Alexander had in 2005 that led to his earning the NFL Most Valuable Player. In every category, Shaun Alexander bests Marshawn Lynch, and let’s not forget that Lynch is a Beast! Alexander scored an eye-popping 28 TD’s, double that to Lynch and gained more than one yard per carry and had a team record of 8 100+ yard games. Don’t get me wrong, Marshawn Lynch is a special player. But that speaks even more to the special kind of year Alexander had in 2005. ADVANTAGE: 2005
Wide Receiver
Comparing a group of WR is a little difficult. As a group, they share the load and spread the field and the statistics. I chose the leading scoring WR from 2005 to the leading yardage WR from this year’s team. I compared:- Number of Touchdowns
- Total Receiving Yards
- Yards After Catch
- Number of 100+ Yard Games
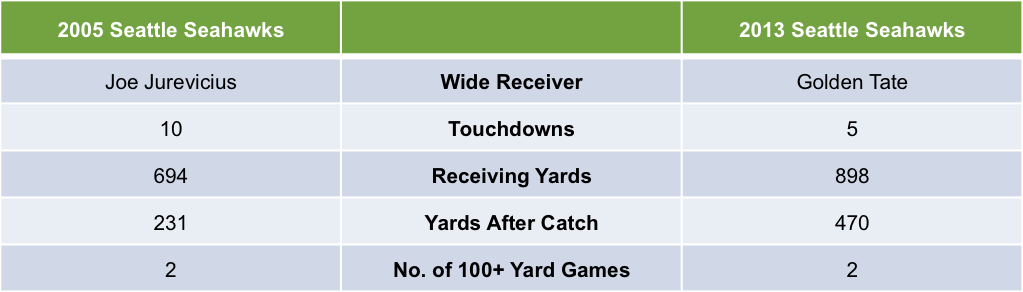
While Joe Jurevicius had twice as many touchdowns, Golden Tate had approximately 30% more overall yards and twice as many yards after the catch. They both had the same number of 100+ yard games. Looking at the collective of WR on both teams and their combined statistics, I rate this category a push. The 2005 team had Bobby Engram and Darrell Jackson, while the current team boasts the talents of Percy Harvin and sure-handed Doug Baldwin. It’s pretty even and too close to call one way or the other. ADVANTAGE: EVEN
Defense
Since we have already established that “Defense Wins Championships,” you could argue that this could be the most important comparison. Before you read the table below, if I asked you which defense had more sacks and allowed the fewest rushing yards against, would you have guessed that it would be the 2005 Seattle Seahawks Defense? I wouldn’t have guessed that. Surely, that would be the Legion of Boom. To compare the stop troops, I reviewed:- Number of Sacks
- Rushing Yards Against
- QB Rating Against
- Total Points Against
- Defensive Touchdowns
- Total defense NFL Ranking
- Scoring Defense NFL Ranking
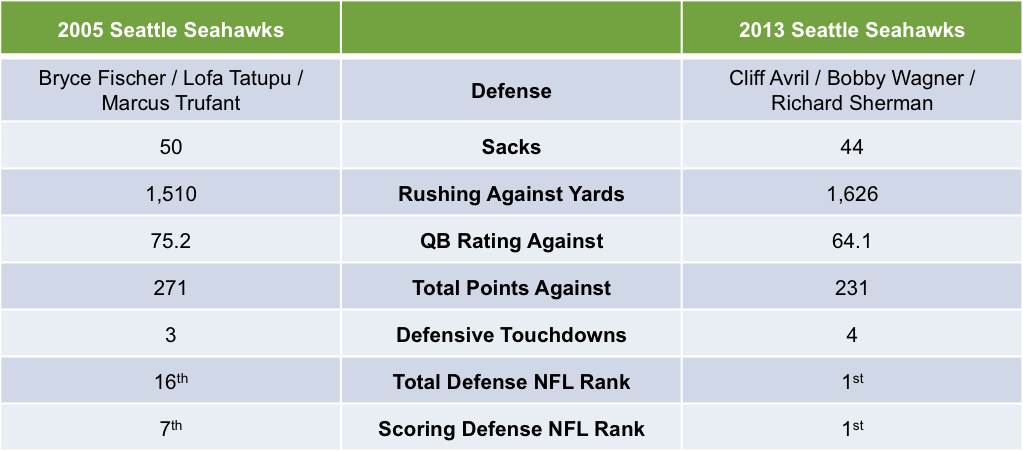
While the first two statistics are a bit surprising, beginning with the QB Rating Against, the 2013 Seattle Seahawks treats this category like it does its opponents and takes over and dominates to completion. As mentioned earlier, the average NFL QB rating since 2008 is 83.2 and the average NFL QB Rating from the early 1970s (when this stat was developed) through the rest of the 1990s, an average NFL QB Rating was 66.7 and the 2013 Legion of Boom holds its opponents to below that standard, which is truly a remarkable feat and speaks to the strength of the secondary and the pass rush combined. Also note that earlier, is the winning percentage in the Super Bowl when the #1 Overall NFL Defense plays, winning 76.2% of the time. From Scoring Defense to Pass Defense, the 2013 Seattle Seahawks are clearly the better overall unit. ADVANTAGE: 2013
Special Teams
Special Teams sometimes seems like the little kid brother to Offense and Defense. My high school coach Grant Shipley used to say, you have to win Offense or Defense + Special Teams and you’ll win the game. I chose three metrics that cover the major areas of special teams:- Average Net Punt
- Average Kickoff Return Against
- Field Goal Percentage
While it’s great if you have a punter that can kick long yards, what is nearly equally as important is how well your coverage teams make the tackle. This is why I chose Average Net Punt, and the same goes for Kickoff coverage. Extra Points should be a nearly a gimme, which is why they are only worth one point; however, Field Goals could be 40 or 50 yards away and are no guarantee; so, they are inherently more valuable.
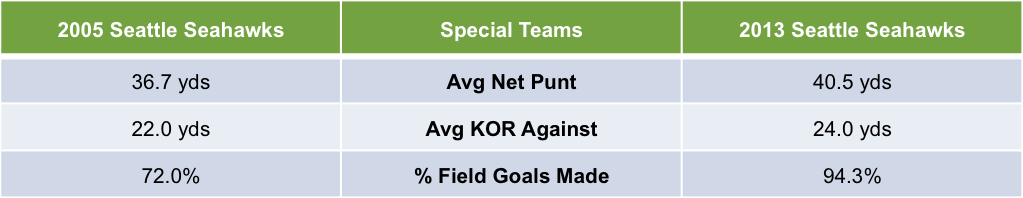
Looking at the table, it can be hard to discern the differences. The 2013 team has a near 4 yard advantage to the net punt, while the 2005 team is on-average 2 yards better in kickoff coverage. The notable difference that separates the men from the boys, is the the 22.3% differential in Field Goals % Made. This is huge. On 100 attempted FG over a season, that is a 67 point difference, which is 2-3 full games worth of scoring to put it in perspective. ADVANTAGE: 2013
The winner is?
To summarize, I put it all in this nice, neat summary table: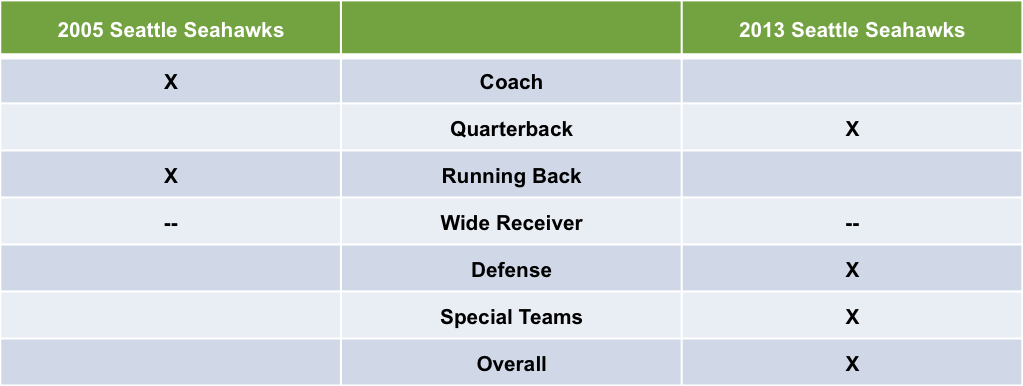
While my analysis points to a clear leader, the 2013 Seattle Seahawks, several categories were very close and arguments using different statistics may point to a slightly different outcome. That said, the 2013 Seattle Seahawks Defense and Special Teams appear to be clear winners over the 2005 team. The Seahawk’s ability to hold opposing QB to a ridiculously low 64.1 QB Rating combined with its 94.3% FG made, make for a pretty convincing argument. Further, the 2013 Seattle Seahawks have the #1 Overall Defense in the NFL and that team has won 76.2% of the 21 Super Bowls played by the league’s best stop unit—all of which bodes well for Pete Carroll and crew in the meadowlands this Sunday, who just might pull even with “the Walrus” and get his first ever Super Bowl victory. OVERALL ADVANTAGE: 2013
This is part 1 of a 2-part analysis. In our next segment, we’ll statistically compare the 2013 Seattle Seahawks to the 2013 Denver Broncos.
- by David Sheffield
Business Director
Analytics Pros, Inc.
Stat pages used to complete this analysis: NFL statistics on NFL.com NFL statistics on ESPN.go.com NFL statistics on sportingcharts.com NFL penalty statistics on teamrankings.com AFL & NFL statistics on pro-football-reference.com Information on Wikipedia